. 2012 Jul 24;22(14):1302-8.
doi: 10.1016/j.cub.2012.05.049. Epub 2012 Jun 21.

Propagation of Dachsous-Fat planar cell polarity

Affiliations

Propagation of Dachsous-Fat planar cell polarity

Abhijit A Ambegaonkar et al. Curr Biol. .

Abstract

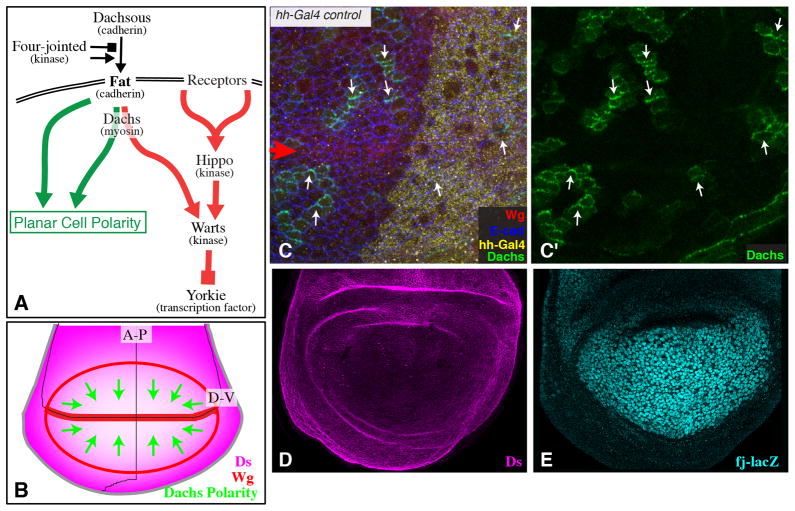
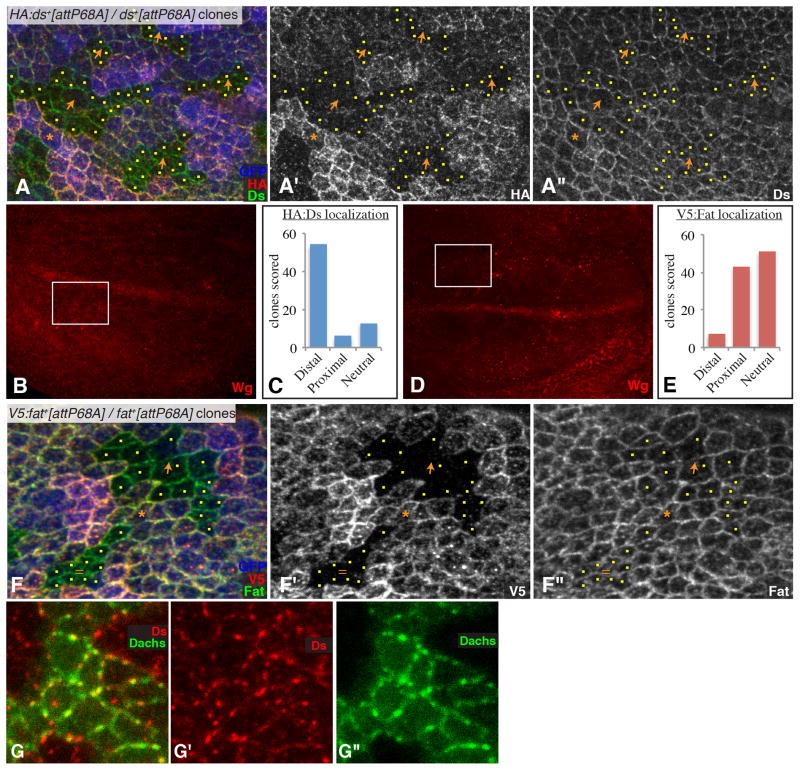
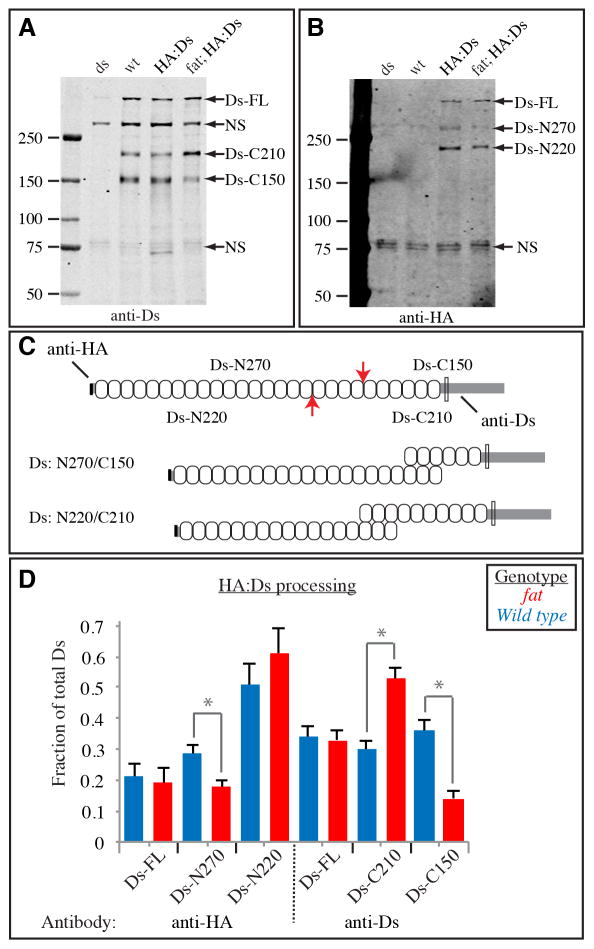
The Fat pathway controls both planar cell polarity (PCP) and organ growth. Fat signaling is regulated by the graded expression of the Fat ligand Dachsous (Ds) and the cadherin-domain kinase Four-jointed (Fj). The vectors of these gradients influence PCP, whereas their slope can influence growth. The Fj and Ds gradients direct the polarized membrane localization of the myosin Dachs, which is a crucial downstream component of Fat signaling. Here we show that repolarization of Dachs by differential expression of Fj or Ds can propagate through the wing disc, which indicates that Fj and Ds gradients can be measured over long range. Through characterization of tagged genomic constructs, we show that Ds and Fat are themselves partially polarized along the endogenous Fj and Ds gradients, providing a mechanism for propagation of PCP within the Fat pathway. We also identify a biochemical mechanism that might contribute to this polarization by showing that Ds is subject to endoproteolytic cleavage and that the relative levels of Ds isoforms are modulated by Fat.


Figures

Fig. 1
Fig. 1. Fat signaling and Dachs polarity in the wing disc
A) Simplified schematic of the Fat signaling pathway. Fat is regulated by Dachsous and Four-jointed. Fat regulates Hippo signaling (red arrows) through Dachs, and regulates PCP signaling (green arrows) partly through Dachs and partly independently of Dachs. B) Schematic of wing disc with the Ds gradient indicated in magenta, and the direction of Dachs polarization indicated by green arrows. The A-P and D-V compartment boundaries are indicated by thin black lines, and Wg expression is indicated in red. C) Dachs:Cit polarization in a wing disc with wild-type Ds and Fj expression, stained for Wg (red), hh-Gal4 (yellow, revealed by Dcr2 staining from a UAS-Dcr2 transgene), and E-cadherin (E-cad, blue, outlines all cells). The polarity of Dachs localization is indicated by small white arrows pointing in the direction of Dachs:Cit membrane localization. Large Red arrow points to the D-V Wg stripe. D) Ds protein staining in a wild-type wing disc. E) Fj expression in a wild-type wing disc, revealed by a fj-lacZ transgene.
Fig. 2
Fig. 2. Non-autonomous repolarization of Dachs by boundaries of Fj or Ds expression
A–B) Examples of wing discs with clones of cells expressing Dachs:Cit (green) from an AyDachs:Cit transgene. These discs are stained for expression of Wg (red, marks D-V boundary, highlighted by large red arrow), hh-Gal4 (yellow, revealed by expression of Dcr2 from a UAS-Dcr2 transgene), and E-cad (blue, outlines cells). The polarity of Dachs localization is indicated by small arrows pointing in the direction of Dacsh:Cit membrane localization; white arrows indicate normal polarity, yellow arrows indicate repolarization. Panels marked prime show the Dachs:Cit channel only from the image to the left. These animals also express either: A) UAS-ds, or B) UAS-fj. C) For each of 4 genotypes, comprising animals expressing the indicated transgenes under hh-Gal4 control, and in each of 3 regions (distal half of the wing pouch, proximal half of the wing pouch, or dorsal hinge), we identified anterior Dachs:Cit-expressing clones near (within 8 cells) of the A-P compartment boundary. In each disc, the number of cells to the farthest Dachs:Cit clone with evident repolarization towards or away from the compartment boundary was recorded (green). Because the clone frequency was relatively low, only a few relative positions are represented in each wing disc, but a representative sampling was achieved by scoring many discs (for each genotype, between 50 and 100 clones were scored in total). In addition, to set an upper limit on the extent of repolarization we also scored the closest Dachs:Cit clones without evident repolarization (red). The range of cell numbers obtained in each case is presented using a “box and whiskers plot”, where the box indicates the range of cell distances in the middle 50% of the distribution, and the line within the box indicates the mean value (if no line is visible the mean overlapped the number of cells represented by the 25% or 75% value, and if no box is visible it indicates that the 25% and 75% values overlapped the mean). Lines outside the box extend to the maximum and minimum distances obtained in that class. D–G) Schematics of wing discs, with Ds, Wg, and hh-Gal4 expression indicated. Green arrows indicate direction and relative range of Dachs repolarization. See also Fig. S1
Fig. 3
Fig. 3. Polarization of Fat and Ds localization in the wing
A) Example of a Ubi-GFP attB-P[acman-HA:ds+] FRT80/attB-P[acman-ds+] FRT80 clones in a wing disc, stained for Ds (green/white) and HA (red/white) and labeled by GFP (blue) as indicated. Orange arrows indicate observed polarity of HA:Ds localization, yellow dots mark cells at clone edges. Orange asterisk marks a cell expressing tagged Ds that has unlabeled cells on both its distal and proximal sides; this situation is rare but when it occurs Ds polarization is evident. B) Shows the same wing disc as in (A), but at lower magnification and with Wg expression visible (red), the white rectangle identifies the location of the image in (A). C) Summarizes the results of blind scoring of 73 clones for HA:Ds polarization. D) Shows the same wing disc as in (F), but at lower magnification and with Wg expression visible (red), the white rectangle identifies the location of the image in (F). E) Summarizes the results of blind scoring of 101 clones for V5:Fat polarization. F) Example of a Ubi-GFP attB-P[acman-V5:fat+] FRT80/attB-P[acman-fat+] FRT80 clones in a wing disc, stained for Fat (green/white) and V5 (red/white) and labeled by GFP (blue) as indicated. Orange arrows indicate observed polarity of V5:Fat localization, yellow dots mark cells at clone edges. Equal sign indicates a clone where Fat was scored as not significantly polarized. Orange asterisk marks a cell expressing tagged Fat that has unlabeled cells on both distal and proximal edges, a slight polarization of Fat is evident. G) Close-up of a portion of a wing disc with a Dachs:Cit-expressing clone (green), Stained for expression of Ds (red). Panels marked by prime symbols show individual stains of the image to the left. See also Fig. S2
Figure 4
Figure 4. Endoproteolytic processing of Ds
A,B) Western blot on lysates of wing discs, from ds mutant (dsUA071/ds36D), wild-type, HA:Ds-expressing, and HA:Ds-expressing fat mutant (fat8/fatG-rv). The left lane contains size markers of the indicated molecular weights. The presumed identities of bands in other lanes are indicated by the labels to the right. The same membrane is depicted in both panels, A shows the results of anti-Ds staining, B shows the results of anti-HA staining. C) Schematic of Ds protein. Upper indicates the approximate locations of endoproteolytic cleavage sites (red arrows) and the resulting polypeptides, and the epitopes of antisera used. Ovals indicate cadherin domains, the transmembrane domain is indicated by the thin rectangle. Lower indicates the Ds isoforms that could result from cleavage at the two different sites. D) Quantitation of Ds processing. The fraction of Ds in each of the three bands detected by each antisera was calculated by summing the intensities of all bands. Bars show the average results from six Western blots on three independently prepared lysates, error bars indicate standard error of the mean. The influence of Fat on Ds processing was significant by t test evaluation of the differences between the fractions of the isoforms indicated by gray bars and asterisks (Ds-N270, P=0.025, Ds-C210, P=0.0008, Ds-C150, P=0.0004). For Ds-N220 the difference was not significant (P=0.36). See also Fig. S3.

Comment in

References

    1. Thomas C, Strutt D. Developmental dynamics: an official publication of the American Association of Anatomists. 2011. The roles of the cadherins Fat and Dachsous in planar polarity specification in Drosophila. - PubMed
    1. Reddy BV, Irvine KD. The Fat and Warts signaling pathways: new insights into their regulation, mechanism and conservation. Development. 2008;135:2827–2838. - PubMed
    1. Willecke M, Hamaratoglu F, Sansores-Garcia L, Tao C, Halder G. Boundaries of Dachsous Cadherin activity modulate the Hippo signaling pathway to induce cell proliferation. Proc Natl Acad Sci U S A. 2008;105:14897–14902. - PMC - PubMed
    1. Rogulja D, Rauskolb C, Irvine KD. Morphogen control of wing growth through the Fat signaling pathway. Dev Cell. 2008;15:309–321. - PMC - PubMed
    1. Mao Y, Rauskolb C, Cho E, Hu WL, Hayter H, Minihan G, Katz FN, Irvine KD. Dachs: an unconventional myosin that functions downstream of Fat to regulate growth, affinity and gene expression in Drosophila. Development. 2006;133:2539–2551. - PubMed

Publication types

MeSH terms

LinkOut - more resources