. 2012 Jul;2(7):638-51.
doi: 10.1158/2159-8290.CD-12-0093. Epub 2012 May 10.

The transcription factor ZNF217 is a prognostic biomarker and therapeutic target during breast cancer progression

Affiliations

The transcription factor ZNF217 is a prognostic biomarker and therapeutic target during breast cancer progression

Laurie E Littlepage et al. Cancer Discov. 2012 Jul.

Abstract

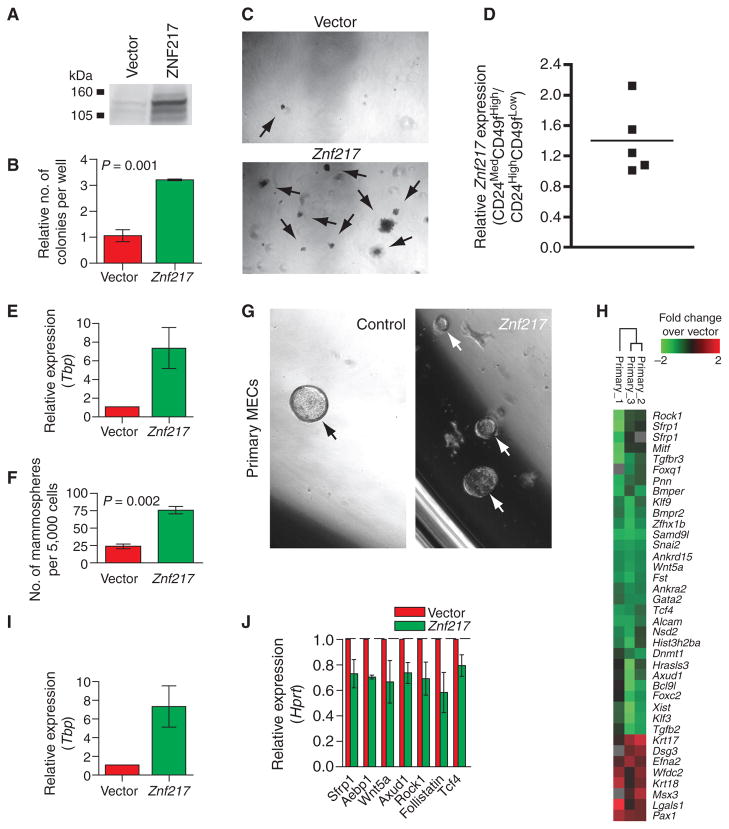
The transcription factor ZNF217 is a candidate oncogene in the amplicon on chromosome 20q13 that occurs in 20% to 30% of primary human breast cancers and that correlates with poor prognosis. We show that Znf217 overexpression drives aberrant differentiation and signaling events, promotes increased self-renewal capacity, mesenchymal marker expression, motility, and metastasis, and represses an adult tissue stem cell gene signature downregulated in cancers. By in silico screening, we identified candidate therapeutics that at low concentrations inhibit growth of cancer cells expressing high ZNF217. We show that the nucleoside analogue triciribine inhibits ZNF217-induced tumor growth and chemotherapy resistance and inhibits signaling events [e.g., phospho-AKT, phospho-mitogen-activated protein kinase (MAPK)] in vivo. Our data suggest that ZNF217 is a biomarker of poor prognosis and a therapeutic target in patients with breast cancer and that triciribine may be part of a personalized treatment strategy in patients overexpressing ZNF217. Because ZNF217 is amplified in numerous cancers, these results have implications for other cancers.

Significance: This study finds that ZNF217 is a poor prognostic indicator and therapeutic target in patients with breast cancer and may be a strong biomarker of triciribine treatment efficacy in patients. Because previous clinical trials for triciribine did not include biomarkers of treatment efficacy, this study provides a rationale for revisiting triciribine in the clinical setting as a therapy for patients with breast cancer who overexpress ZNF217.


Conflict of interest statement

Disclosure of Potential Conflicts of Interest

J.W. Gray has a Commercial Research Grant from GlaxoSmith-Kline, Pfizer and Susan G. Komen and is a consultant/advisory board member for New Leaf Ventures, Agendia, and KromaTiD. No potential conflicts of interests were disclosed by the other authors.

Figures

Figure 1
Figure 1
ZNF217 overexpression is a prognostic indicator in patients with breast cancer. A, patients (N = 118; ref. 11) were separated by high (n = 59) versus low (n = 59) ZNF217 expression and analyzed for overall survival (P = 0.003; log-rank). B, relapse-free survival (12) based on high (n = 40) versus low (n = 41) ZNF217 expression (P = 0.01; log-rank). C, patients (N = 858) were separated by low (n = 286), intermediate (n = 286), and high (n = 286) ZNF217 expression and analyzed for relapse-free survival. Patients with high ZNF217 expression had worse survival than low ZNF217 patients (P = 0.03; log-rank) as described in Supplementary Materials.
Figure 2
Figure 2
Znf217 overexpression promotes increased cell motility and aberrant epithelial marker expression. A, relative Znf217 expression levels by qRT-PCR in SCp2 mammary epithelial cell lines infected with virus to overexpress vector or Znf217 with comparable results in 3 experiments. Each sample was tested by qRT-PCR in triplicate relative to the reference TATA box binding protein (Tbp), with similar results for other reference genes. Graphs show the mean ± SEM. B, Western blot analysis of ZNF217 protein (anti-ZNF217) and loading control (anti-HDAC1) in SCp2 cells. Images are representative of multiple experiments using retrovirus or lentivirus overexpression of Znf217. Arrows mark the indicated proteins. C, brightfield images of SCp2 cells ± Znf217 display increased cell scattering in culture after Znf217 overexpression. D, frames from movies of SCp2 cells infected with vector or ZNF217 following a scratch with a pipette tip. The movies ran 20.25 hours. Note the lamellipodia (arrow) extending from the cells by 5.5 hours and the increased number of Znf217-expressing cells in the middle of the scratch by 10.5 hours (arrow). E, phalloidin staining of SCp2 cells Znf217. F, relative expression of Znf217 and selected genes by qRT-PCR from NMuMG (top) and SCp2 (bottom) cells ± Znf217 in vitro. Graph shows the mean ± SEM, relative to the reference Gapdh. Similar results were seen with the reference Hprt. For each gene, samples for Znf217 were compared with vector by Mann–Whitney tests, and significant P values <0.02 were marked with *. G, heat map of selected genes enriched following Znf217 overexpression in SCp2 cells. Gapdh, glyceraldehyde-3-phosphate dehydrogenase; Hprt, hypoxanthine phosphoribosyltransferase.
Figure 3
Figure 3
Znf217 overexpression causes an increase in soft agar colonies and in mammosphere formation. A, Western blot analysis of ZNF217 protein in NIH3T3 cells infected with vector or Znf217 retrovirus. B, Znf217 overexpression increases the number of colonies by anchorage-independent growth in soft agar assay. Relative number of colonies per well by soft agar with vector or Znf217 overexpression (P = 0.001; Student t test). Graph compiles results from 3 experiments, each done in triplicate. C, brightfield images of anchorage-independent colonies from soft agar assay ± ZNF217 in (B). Arrows mark examples of colonies. The large colonies were only seen with the Znf217-overexpressing cells, whereas much smaller colonies were seen with vector-expressing cells. D, relative expression of Znf217 by qRT-PCR from normal adult mammary gland (FVB/n), relative to the reference Hprt with line marking the mean. Glands were sorted by flow cytometry for CD24MedCD49fHigh (basal/myoepithelial/progenitor cells) and CD24High-CD49fLow (luminal/luminal progenitor) fractions. RNA was isolated and used to generate cDNA from each population. Each dot represents one mouse sorted, collected, and processed by qRT-PCR. Graph shows relative epithelial Znf217 expression in the CD24MedCD49fHigh versus CD24HighCD49fLow populations. Similar results were seen with the reference Gapdh. E, relative expression of Znf217 by qRT-PCR in primary mouse MECs following lenti-viral infection with either pEiT vector or Znf217-pEiT in 3 separate samples. Each sample was tested by qRT-PCR in triplicate relative to the reference Tbp. These samples were used for microarray analysis. Graph shows the mean ± SEM. Quantification (F) and brightfield images (G) of mammosphere assay of Vo-PyMT cells overexpressing vector or Znf217. H, heat map of selected genes from gene expression microarray analysis enriched in primary MECs overexpressing Znf217. I, relative expression of Znf217 by qRT-PCR in primary mouse MECs following lentiviral infection with either vector or Znf217 in 3 separate samples. Each sample was tested by qRT-PCR in triplicate relative to the reference Tbp and used for microarray analysis. Graph shows the mean ± SEM. J, qRT-PCR to validate microarray targets using the same samples used in (H) with Hprt as a reference in qRT-PCR reactions. Similar results were obtained with Gapdh used as a reference (data not shown). Gapdh, glyceraldehyde-3-phosphate dehydrogenase; Hprt, hypoxanthine phosphoribosyltransferase.
Figure 4
Figure 4
Znf217 overexpression in vivo increases rate of tumor progression, tumor heterogeneity, and differentiation state. A, relative expression of Znf217 and EMT genes by qRT-PCR in the Vo-PyMT cell line overexpressing either vector or Znf217. The assay used the reference Gapdh. Similar results were seen using Hprt or Tbp references. The cells used in this experiment had previously been sorted for fluorescent marker expression and were used for the Vo-PyMT transplants throughout this study. B, mammosphere assay of primary MECs infected with vector or Znf217-overexpressing lentivirus. C, quantification of mammosphere formation in primary MECs expressing vector or Znf217 after 1 week. Graph shows mean ± SEM, and samples were compared by unpaired t test. D, tumor-free survival over time in Vo-PyMT transplants (P = 0.01; log-rank). E, tumor volume over time in Vo-PyMT transplants of Znf217 (n = 8) versus vector (n = 10; P = 0.007; ANOVA, repeated measures). F, final tumor weight in Vo-PyMT transplants (P = 0.02; Mann–Whitney). Line represents median of vector (n = 9) versus Znf217 (n = 8). G, H&E staining of MMTV-PyMT (PyMT MEC) tumors from transplants overexpressing vector (top) or Znf217 (middle, bottom). Insets are enlarged images of boxed regions and show heterogeneous pathology. H, immunofluorescence staining with anti-Keratin-8 (green), anti-α-SMA (red; arrows), and DNA (Hoechst; blue) in tumors derived from PyMT MEC transplants. I, immunofluorescence staining with anti-Keratin-8 (green), keratin-14 (red), and DNA (blue) from PyMT MEC transplants. Arrows mark cells double-positive for K8 and K14. J, quantification of a progenitor cell population: K8+K14+ (P = 0.002), percentage of K8+K14+ (P = 0.0002; unpaired t tests). Bar graphs show mean representation [n (%)] of K8+K14+ cells ± SEM per HPF. Gapdh, glyceraldehyde-3-phosphate dehydrogenase; HPF, 3 high-powered fields. Hprt, hypoxanthine phosphoribosyltransferase.
Figure 5
Figure 5
Znf217 overexpression in vivo increases lung metastasis. A, immunofluorescence with anti-E-cadherin (green) and DNA (blue) from Vo-PyMT transplants. Arrows mark regions with low E-cadherin expression. B, number of lung metastases per 3 (i) or 5 (ii) high-powered fields from (i) PyMT MEC (P = 0.008) or (ii) Vo-PyMT transplants (P = 0.01; Mann–Whitney) with vector orZnf217 overexpression. Bar graph shows the mean ± SEM. C, metastatic burden from PyMT and Vo-PyMT transplants. Number of lung metastases per 3 (PyMT) or 5 (Vo-PyMT) high-powered fields divided by tumor weight from (i) PyMT MEC (P = 0.003; Mann–Whitney) or (ii) Vo-PyMT (P = 0.32; Mann–Whitney) transplants with vector or Znf217 overexpression. Bar graph shows the mean ± SEM. Similar results were obtained using final tumor volume (data not shown). D, H&E staining of lung metastases from PyMT MEC transplants. Arrows mark examples of metastases. E, metastasis-free survival based on high (n = 41) versus low (n = 41) ZNF217 expression (P = 0.01; log-rank) from the work of Minn and colleagues (19).
Figure 6
Figure 6
Identification of triciribine as a candidate inhibitor of ZNF217-induced growth. A, response to neoadjuvant chemotherapy in patients with breast cancer with high versus low ZNF217 expression in tumors (i) from the work of Sorlie and colleagues (12). Patients had responsive (n = 27) or non-responsive (stable/progressive) disease (n = 28) in response to treatment (P = 0.01; Mann–Whitney). Lines mark means; (ii) from Hess and colleagues (ref. ; P < 0.001; Mann-Whitney). Tumors were responsive (pathologic complete response; n = 34) or nonresponsive (residual disease; n = 34) to treatment. Lines mark means. B, ZNF217 and ERBB3 expression levels in human breast tumors (n = 118) from Chin and colleagues (11). ZNF217 and ERBB3 strongly correlate (Pearson r = 0.47; R2 = 0.22; by linear regression, P < 0.0001). C, MCF7 cells (left) or ZR-75-1 cells (right) were transiently transfected with scrambled or ZNF217-siRNA. Forty-eight hours after transfection, cells were serum-starved 24 hours and treated for 15 minutes with heregulin. Lysates were blotted for the indicated proteins. D, PI3K and AKT inhibitors do not promote ZNF217-dependent cell death. Fluorescence-activated cell-sorting (FACS) analysis of cell death by Annexin V staining in MCF7 cells ± ZNF217-shRNA or scramble control and treated for 2 days with control, 2 μmol/L GDC0941, or 10 μmol/L MK2206. E, treatment of MCF7 cells ± ZNF217-shRNA with bisacodyl in triplicate at the indicated concentrations (P = 0.001; ANOVA). Similar results were obtained in at least 3 experiments. F, treatment of MCF7 cells ± ZNF217-shRNA with 10 mol/L triciribine at the indicated concentrations (P = 0.001; ANOVA). Similar results were obtained with a second shRNA and in at least 3 experiments. ZNF217 (G) expression levels and related triciribine GI50 concentrations (H) in NCI60 panel breast cancer cell lines. Inset, chemical structure of triciribine. I, ZNF217 expression levels (Neve data set, ref. 28) across triciribine GI50s in 30 breast cancer cell lines (15 each of cell lines expressing highest/lowest ZNF217; r = −0.39; P = 0.035; Spearman correlation). Two outliers circled are identified by cell type and relevant mutations. DMSO, dimethyl sulfoxide.
Figure 7
Figure 7
Triciribine inhibits ZNF217 in vivo and in human cells. A, tumor burden growth rate of Vo-PyMT transplants treated with dimethyl sulfoxide (DMSO) solution (solid lines) or triciribine (dotted line; P < 0.0001 by genotype; P = 0.02, genotype over time; ANOVA). Vo-PyMT transplants overex-pressed vector (blue) or Znf217 (orange). Shown are the mean ± SEM. B, phospho-AKT (left) and phospho-MAPK (right) protein expression by immuno-histochemistry in tissues from Vo-PyMT transplants treated with either control or triciribine. C, model of pathways downstream from ZNF217. Znf217 overexpression promotes phospho-AKT and phospho-MAPK. This activation is associated with increased tumor burden, chemotherapy resistance, and mammosphere formation. Triciribine can block these phenotypes of Znf217 overexpression. D, MCF7 cells ± triciribine were serum-starved overnight and stimulated with heregulin/neuregulin-1β for the indicated times. Cell lysates were blotted for the indicated proteins. E, human MCF7-M1 subcutaneous xenografts treated with control or triciribine (50 mg/kg) at the indicated time posttransplant. Ticks show mean tumor burden ± SD. F, triciribine induces synthetic lethality with doxorubicin in culture. Stable HBL100 MECs (low Znf217, low adenosine kinase expression; Znf217) were treated with triciribine and doxorubicin at the indicated concentrations and monitored for cell death using Annexin V staining (P = 0.0002; ANOVA). All doxorubicin-treated samples were statistically different (P < 0.05; Bonferroni posttest), whereas triciribine treatment alone did not promote statistically significant results. Graph shows mean ± SEM. G, model of ZNF217 function. Increased ZNF217 promotes increased ERBB3 expression and activation of downstream signaling events during tumor progression. ZNF217 may also activate other receptor tyrosine kinases (RTK) that in turn lead to activation of AKT or MAPK pathways. In vivo during tumor progression, triciribine can block signaling events downstream of ZNF217 overexpression.

References

    1. Collins C, Rommens JM, Kowbel D, Godfrey T, Tanner M, Hwang SI, et al. Positional cloning of ZNF217 and NABC1: genes amplified at 20q13. 2 and overexpressed in breast carcinoma. Proc Natl Acad Sci U S A. 1998;95:8703–8. - PMC - PubMed
    1. Collins C, Volik S, Kowbel D, Ginzinger D, Ylstra B, Cloutier T, et al. Comprehensive genome sequence analysis of a breast cancer amplicon. Genome Res. 2001;11:1034–42. - PMC - PubMed
    1. You A, Tong JK, Grozinger CM, Schreiber SL. CoREST is an integral component of the CoREST- human histone deacetylase complex. Proc Natl Acad Sci U S A. 2001;98:1454–8. - PMC - PubMed
    1. Shi Y, Sawada J, Sui G, Affar el B, Whetstine JR, Lan F, et al. Coordinated histone modifications mediated by a CtBP co-repressor complex. Nature. 2003;422:735–8. - PubMed
    1. Quinlan KG, Nardini M, Verger A, Francescato P, Yaswen P, Corda D, et al. Specific recognition of ZNF217 and other zinc finger proteins at a surface groove of C-terminal binding proteins. Mol Cell Biol. 2006;26:8159–72. - PMC - PubMed

Publication types

MeSH terms

Associated data