

Stat3 inhibition augments the immunogenicity of B-cell lymphoma cells, leading to effective antitumor immunity
- PMID: 22728650
- PMCID: PMC3990429
- DOI: 10.1158/0008-5472.CAN-11-3619
Stat3 inhibition augments the immunogenicity of B-cell lymphoma cells, leading to effective antitumor immunity
Abstract
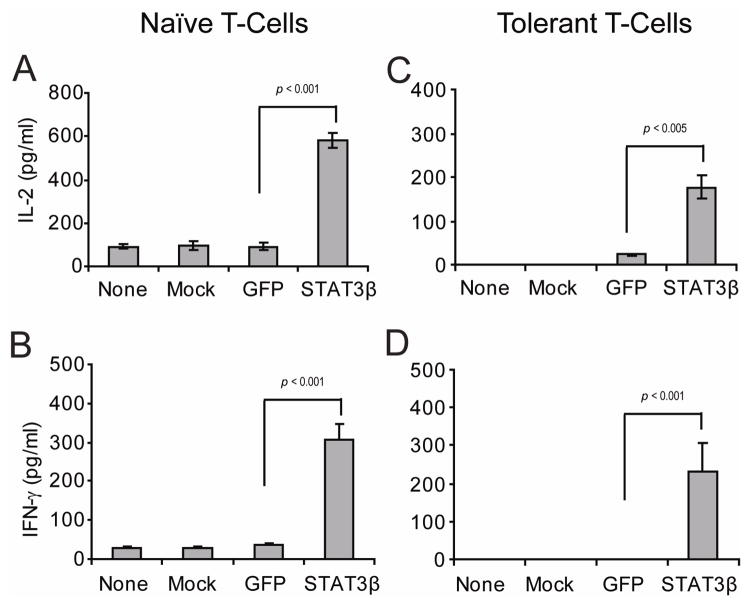
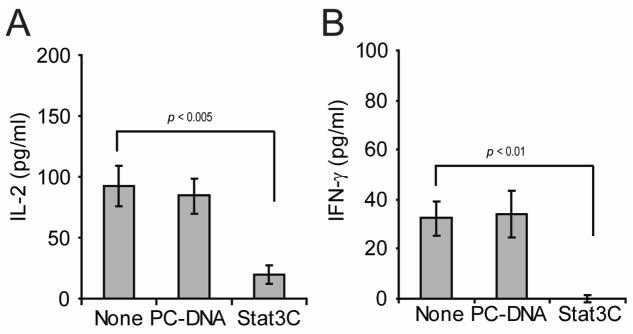
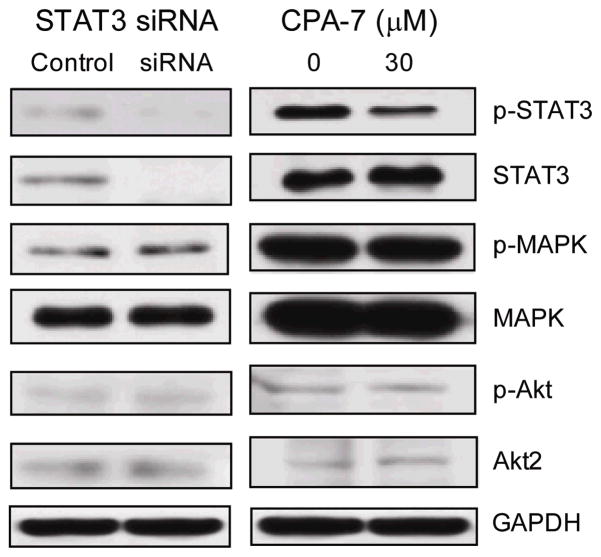
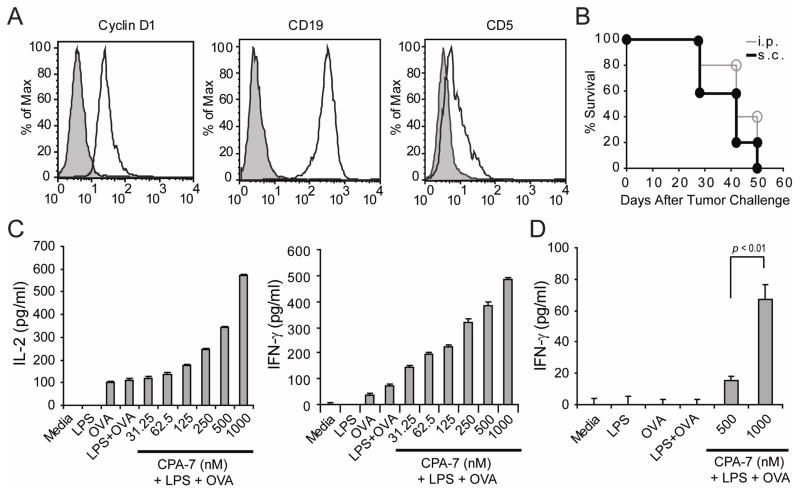
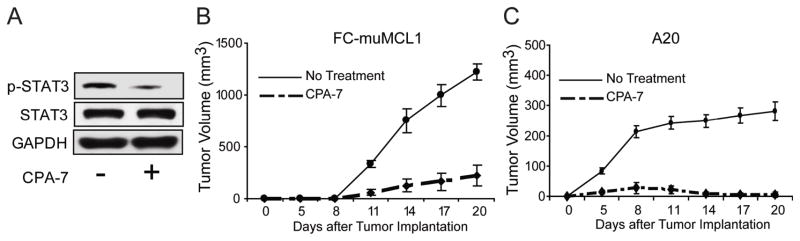
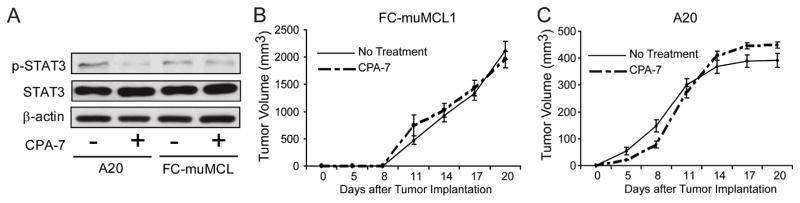
Mantle cell lymphoma (MCL) is an aggressive and incurable subtype of B-cell non-Hodgkin lymphomas. Although patients often respond initially to first-line treatment with chemotherapy plus monoclonal antibodies, relapse and decreased response to further lines of treatment eventually occurs. Harnessing the immune system to elicit its exquisite specificity and long-lasting protection might provide sustained MCL immunity that could potentially eradicate residual malignant cells responsible for disease relapse. Here, we show that genetic or pharmacologic disruption of Stat3 in malignant B cells augments their immunogenicity leading to better activation of antigen-specific CD4(+) T cells and restoration of responsiveness of tolerized T cells. In addition, treatment of MCL-bearing mice with a specific Stat3 inhibitor resulted in decreased Stat3 phosphorylation in malignant B cells and anti-lymphoma immunity in vivo. Our findings therefore indicate that Stat3 inhibition may represent a therapeutic strategy to overcome tolerance to tumor antigens and elicit a strong immunity against MCL and other B-cell malignancies.
©2012 AACR.
Conflict of interest statement
Disclosure of Potential Conflicts of Interest:
No potential conflicts of interest were disclosed.
Figures
Similar articles
-
Inhibition of STAT3 activity re-activates anti-tumor immunity but fails to restore the immunogenicity of tumor cells in a B-cell lymphoma model.Cancer Biol Ther. 2014 Sep;15(9):1153-62. doi: 10.4161/cbt.29453. Epub 2014 Jun 10. Cancer Biol Ther. 2014. PMID: 24915165 Free PMC article.
-
The STAT3 inhibitor WP1066 synergizes with vorinostat to induce apoptosis of mantle cell lymphoma cells.Biochem Biophys Res Commun. 2015 Aug 14;464(1):292-8. doi: 10.1016/j.bbrc.2015.06.145. Epub 2015 Jun 24. Biochem Biophys Res Commun. 2015. PMID: 26116769
-
Degrasyn potentiates the antitumor effects of bortezomib in mantle cell lymphoma cells in vitro and in vivo: therapeutic implications.Mol Cancer Ther. 2010 Jul;9(7):2026-36. doi: 10.1158/1535-7163.MCT-10-0238. Epub 2010 Jul 6. Mol Cancer Ther. 2010. PMID: 20606045 Free PMC article.
-
The emerging role of lenalidomide in the management of mantle cell lymphoma (MCL).Best Pract Res Clin Haematol. 2012 Jun;25(2):185-90. doi: 10.1016/j.beha.2012.04.005. Epub 2012 May 18. Best Pract Res Clin Haematol. 2012. PMID: 22687454 Review.
-
The molecular pathogenesis of mantle cell lymphoma.Leuk Lymphoma. 2017 Jul;58(7):1530-1537. doi: 10.1080/10428194.2016.1248965. Epub 2016 Nov 28. Leuk Lymphoma. 2017. PMID: 27894215 Review.
Cited by
-
Myeloid cells as a target for oligonucleotide therapeutics: turning obstacles into opportunities.Cancer Immunol Immunother. 2017 Aug;66(8):979-988. doi: 10.1007/s00262-017-1966-2. Epub 2017 Feb 18. Cancer Immunol Immunother. 2017. PMID: 28214929 Free PMC article. Review.
-
CTLA4 Promotes Tyk2-STAT3-Dependent B-cell Oncogenicity.Cancer Res. 2017 Sep 15;77(18):5118-5128. doi: 10.1158/0008-5472.CAN-16-0342. Epub 2017 Jul 17. Cancer Res. 2017. PMID: 28716895 Free PMC article.
-
Histone deacetylase inhibitors enhance CD1d-dependent NKT cell responses to lymphoma.Cancer Immunol Immunother. 2016 Nov;65(11):1411-1421. doi: 10.1007/s00262-016-1900-z. Epub 2016 Sep 10. Cancer Immunol Immunother. 2016. PMID: 27614429 Free PMC article.
-
CD8+ T-cell immunosurveillance constrains lymphoid premetastatic myeloid cell accumulation.Eur J Immunol. 2015 Jan;45(1):71-81. doi: 10.1002/eji.201444467. Epub 2014 Nov 10. Eur J Immunol. 2015. PMID: 25310972 Free PMC article.
-
Functional Analysis of Histone Deacetylase 11 (HDAC11).Methods Mol Biol. 2016;1436:147-65. doi: 10.1007/978-1-4939-3667-0_11. Methods Mol Biol. 2016. PMID: 27246214 Free PMC article.
References
-
- Sotomayor EM, Borrello I, Rattis FM, Cuenca AG, Abrams J, Staveley-O’Carroll K, et al. Cross-presentation of tumor antigens by bone marrow-derived antigen-presenting cells is the dominant mechanism in the induction of T-cell tolerance during B-cell lymphoma progression. Blood. 2001;98(4):1070–1077. - PubMed
-
- Howard OM, Gribben JG, Neuberg DS, Grossbard M, Poor C, Janicek MJ, et al. Rituximab and CHOP induction therapy for newly diagnosed mantle-cell lymphoma: molecular complete responses are not predictive of progression-free survival. J Clin Oncol. 2002;20(5):1288–1294. - PubMed
-
- Witzig TE. Current treatment approaches for mantle-cell lymphoma. J Clin Oncol. 2005;23(26):6409–6414. - PubMed
Publication types
MeSH terms
Substances
Grants and funding
LinkOut - more resources
Full Text Sources
Other Literature Sources
Molecular Biology Databases
Research Materials
Miscellaneous
