. 2012 Aug;30(8):783-91.
doi: 10.1038/nbt.2247.

Derivation of blood-brain barrier endothelial cells from human pluripotent stem cells

Affiliations

Derivation of blood-brain barrier endothelial cells from human pluripotent stem cells

Ethan S Lippmann et al. Nat Biotechnol. 2012 Aug.

Abstract

The blood-brain barrier (BBB) is crucial to the health of the brain and is often compromised in neurological disease. Moreover, because of its barrier properties, this endothelial interface restricts uptake of neurotherapeutics. Thus, a renewable source of human BBB endothelium could spur brain research and pharmaceutical development. Here we show that endothelial cells derived from human pluripotent stem cells (hPSCs) acquire BBB properties when co-differentiated with neural cells that provide relevant cues, including those involved in Wnt/β-catenin signaling. The resulting endothelial cells have many BBB attributes, including well-organized tight junctions, appropriate expression of nutrient transporters and polarized efflux transporter activity. Notably, they respond to astrocytes, acquiring substantial barrier properties as measured by transendothelial electrical resistance (1,450 ± 140 Ω cm2), and they possess molecular permeability that correlates well with in vivo rodent blood-brain transfer coefficients.


Figures
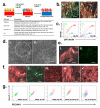
Figure 1
Figure 1. Differentiation of hPSCs to BMECs
(a) Schematic of BMEC differentiation protocol. hPSCs are seeded onto Matrigel in mTeSR1 medium for 2-3 days to allow adherence and cell expansion, then cultured in unconditioned medium for 5-7 days until large colonies with characteristic endothelial cell (EC) morphology are observed. Addition of defined EC medium for 2-6 days facilitates EC expansion prior to subculture onto a collagen/fibronectin matrix for further expansion and purification. iPSC and hPSC lines used in this study and their descriptions are listed. UM = unconditioned medium, EC = endothelial cell medium. (b) βIII tubulin (red) and nestin (green) expression is detected after differentiation of IMR90-4 iPSCs in UM for 4 days (panel i) and 6 days (panel ii). Scale bars indicate 50 μm. (c) Flow cytometric distributions of IMR90-4-derived βIII tubulin+ and nestin+ cells at day 4 and day 6 of UM treatment. Red dots indicate βIII tubulin+/nestin+ cells, blue dots indicate βIII tubulin+/nestin cells, green dots indicate βIII tubulin/nestin+ cells, and black dots indicate βIII tubulin/nestin cells. The data are representative of two biological replicates. (d) Phase contrast image of IMR90-4 iPSCs after 3 days in UM (panel i) and 6 days in UM with 3 additional days in EC medium (panel ii). The circle in panel i indicates a small region with flattened cobblestone EC morphology and is the type of region probed with antibodies in panel 1e. This morphology is shown to be widespread in panel ii and corresponds to the regions identified by immunolabeling in Figure 1f and Supplementary Figure 3. Scale bars indicate 200 μm. (e) IMR90-4 iPSCs cultured for 4 days UM give rise to PECAM-1+ cells (panel i) that do not express tight junction protein claudin-5 (panel ii). Scale bars indicate 50 μm. (f) After 5-7 days of UM treatment, IMR90-4-derived ECs now co-express PECAM-1 (panel i, red) and claudin-5 (panel ii, green, same field). Within these EC colonies, expression of characteristic BBB markers occludin (panel iii), p-glycoprotein (panel iv), and GLUT-1 (panel v) is also observed. All scale bars indicate 50 μm. (g) Flow cytometry dot plots demonstrate the temporal evolution of the PECAM-1+/GLUT-1+ population within differentiating IMR90-4 iPSCs or H9 hESCs. Green dots indicate PECAM-1/GLUT-1 cells, blue dots indicate PECAM-1+/GLUT-1 cells, and red dots indicate PECAM-1+/GLUT-1+ cells. Full quantitative results are found in Table 1.
Figure 2
Figure 2. Wnt/β-catenin signaling involvement in BBB specification from hPSCs
(a) Combined fluorescence in situ hybridization/immunocytochemistry of IMR90-4 cultures at day 4 of UM treatment shows nestin+ (red; panels i and v) and βIII tubulin+ (red; panels iii and vii) cells express both WNT7A (green; panels ii and iv) and WNT7B (green; panels vi and viii). WNT7A/7B are shown overlaid with DAPI nuclear stain (blue). Panels i and ii, iii and iv, v and vi, and vii and viii are the same field. Scale bars indicate 50 μm. (b) Nuclear β-catenin localization increases with differentiation time. Nuclear β-catenin (green) is sparsely observed in IMR90-4-derived PECAM-1+ (red) EC clusters after 4 days of UM treatment (panel i). Arrowheads indicate nuclear β-catenin. Nuclear β-catenin localization (green) increases after 5 days of UM treatment (panel ii) and elevated GLUT-1 (red) is only observed elevated in cells that also have nuclear β-catenin. After 6 days of UM and 2 days of EC medium treatment (panel iii), nuclear β-catenin (green) is co-localized with the majority of PECAM-1+ cells (red). Scale bars in panel i and panel ii indicate 50 μm and scale bar in panel iii indicates 100 μm. (c) Quantitative RT-PCR comparing fold difference gene expression in differentiating IMR90-4 iPSCs demonstrates that Wnt-activated gene expression is temporally correlated with the observed time course of BBB differentiation. The dark bars compare IMR90-4 cells treated with UM for 3 days and 7 days. A positive fold difference represents gene upregulation at 7 days of UM treatment. The white bars indicate IMR90-4 cells treated with UM containing SFRP2 for 7 days. A negative fold difference represents a downregulation of gene transcription in cells treated with UM containing SFRP2 compared to cells only treated with UM. The grey bars indicate IMR90-4 cells treated with XAV-939 from days 2 thru 7 of UM treatment compared to cells treated with DMSO vehicle control. FZD4, FZD7, and APCDD1 expression were not tested in the presence of inhibitors. Error bars indicate standard deviation calculated from triplicate samples. Data are representative of two biological replicates. Statistical analysis was performed using Student’s unpaired t-test; *, p<0.05; **, p<0.005. (d) Flow cytometry of IMR90-4 cells at 6 days of UM and 2 days of EC medium treatment after addition of XAV-939 or DMSO vehicle control starting at day 2 of UM treatment. Cells treated with DMSO show similar distribution to untreated cells (64% PECAM-1+/GLUT-1+ and 68% PECAM-1+ overall; Table 1). Cells treated with XAV-939 show a small reduction in overall PECAM-1+ labeling (61% total) and a marked decrease in the number of PECAM-1+/GLUT-1+ cells (46% total) (Table 1). Red dots indicate PECAM-1+/GLUT-1+ cells, blue dots indicate PECAM-1+/GLUT-1 cells, and green dots indicate PECAM-1/GLUT-1 cells. The results are representative of three biological replicates.
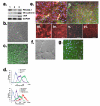
Figure 3
Figure 3. Purification of iPSC-derived BMECs on collagen/fibronectin matrix
(a) Gel electrophoresis of RT-PCR products for transcripts encoding PECAM-1, VE-cadherin, and von Willebrand Factor (vWF) in differentiating IMR90-4 iPSCs after 3 days of differentiation in UM (lane 1), 6 days in UM and 2 days in EC medium (lane 2), or subculture onto a collagen/fibronectin matrix for 2 days (lane 3). (b) Phase contrast image of IMR90-4-derived BMECs on the collagen/fibronectin matrix. Scale bar indicates 100 μm. (c) IMR90-4-derived BMECs were capable of fluorescent acetylated LDL uptake (scale bar indicates 50 μm). (d) Flow cytometry demonstrates purity of IMR90-4-derived BMECs after subculture. ZO-1 and PECAM-1 expression are compared to the appropriate rabbit IgG control, and occludin, claudin-5, and p-glycoprotein expression are compared to the appropriate mouse IgG control in the flow cytometric histograms. (e) Characteristic EC and BBB markers are expressed by purified IMR90-4-derived BMECs. IMR90-4-derived BMECs express PECAM-1 (panel i; red), claudin-5 (panel i; green), vWF (panel ii; red), occludin (panel ii; green), GLUT-1 (panel iii), p-glycoprotein (panel iv), ZO-1 (panel v), and VE-cadherin (panel vi). DAPI nuclear stain (blue) is overlaid in panels i and ii. Scale bars indicate 50 μm. (f) Seeding of purified IMR90-4-derived BMECs onto Matrigel in the presence of 40 ng/mL VEGF leads to vascular tube formation (scale bar indicates 100 μm). In the absence of VEGF, cells did not form tubes. (g) Subculture prior to full differentiation leads to a defective BBB phenotype. Differentiating IMR90-4 cultures purified on the collagen/fibronectin matrix after only 4 days of UM treatment do not grow to confluence and areas with malformed or discontinuous claudin-5 expression (green) are readily observed. Co-label with DAPI is shown (blue). Arrows highlight continuous claudin-5 expression while arrowheads indicate defective claudin-5. Scale bar indicates 50 μm.
Figure 4
Figure 4. Functional barrier properties and BBB characteristics of purified iPSC-derived BMECs
(a) Schematic of a two-compartment blood-brain barrier model. iPSC-derived BMECs are seeded onto a Transwell filter coated with collagen/fibronectin and co-cultured with rat astrocytes to assay for induction of BBB properties. Apical (blood side) and basolateral (brain side) chambers are denoted with respect to the transport assays. (b) iPSC-derived BMECs respond to soluble cues from astrocytes. IMR90-4-derived BMECs were cultured alone (monoculture) or co-cultured with either rat astrocytes or human embryonic kidney (HEK) cells for 96 hours and trans-endothelial electrical resistance (TEER) was monitored. Error bars represent standard deviation of triplicate filters. The preferential TEER response due to astrocyte co-culture compared to HEK co-culture was observed for more than ten biological replicates. See Table 2 for TEER values from experiments with optimized medium and seeding density. (c) Freeze-fracture electron microscopy of IMR90-4-derived BMECs after co-culture with rat astrocytes for 24 hours. “P” indicates protoplasmic face (P-face) and “E” indicates exocytoplasmic face (E-face). Red arrowheads indicate an E-face groove largely devoid of tight junction particles, blue arrowhead highlights an infrequent tight junction particle found at the E-face and the yellow arrowheads indicate the complex network of tight junction particles associated with the P-face. Scale bar indicates 0.2 μm. (d) RT-PCR detection of representative blood-brain barrier transcript expression in IMR90-4-derived BMECs co-cultured with rat astrocytes. Transcript presence was confirmed for LDLR, LRP1, INSR, LEPR, BCAM, TFRC, AGER, STRA6, SLC7A5, SLC1A1, SLC38A5, SLC16A1, SLC2A1, ABCB1, ABCG2, ABCC1, ABCC2, ABCC4, and ABCC5. PLVAP and SLC21A14 transcripts were not detected. Monocultured IMR90-4-derived BMECs had a similar transcript profile except LRP1 and ABCC5 were absent, requiring co-culture with either HEK293 cells or astrocytes for their induction. (e) Correlation between IMR90-4-derived BMEC permeability coefficients (Pe, x-axis) and rodent in vivo transfer coefficients (Kin, y-axis). Pe values (cm/min) were calculated from flux experiments using triplicate filters as described in the Material and Methods section. Depicted are the mean ± S.D. values generated for each compound measured in at least three such experiments. To accumulate these data, five individual co-culture models (independently differentiated from undifferentiated iPSCs) were assembled and 3-6 compounds measured at a time. Sucrose Pe values were also acquired from efflux transporter inhibition assay controls. Thus, the plot accurately depicts the biological variation in Pe measurements amongst completely independent experiments. Colchicine was the only compound having large variability across biological replicates (see Supplementary Table 1 for numerical values). Kin values (μL s−1 g−1) were extracted from plotted in situ rodent brain perfusion data reported in Perriere et al. (f) Functional expression of efflux transporters in IMR90-4-derived BMECs. Accumulation of rhodamine 123 or [14C]-doxorubicin into monocultured IMR90-4-derived BMECs was measured in the presence and absence of cyclosporin A, Ko143, or MK 571 (panel i). Transport of rhodamine 123 or doxorubicin from the apical to basolateral chambers was measured in the two compartment astrocyte co-culture model in the presence and absence of cyclosporin A, Ko143, or MK 571 (panel ii). For all plots, Lane 1 = control, Lane 2 = cyclosporin A addition, Lane 3 = Ko143 addition, Lane 4 = MK 571 addition. Error bars indicate standard deviation calculated from triplicate wells or filters. Data are representative of two biological replicates for each inhibition assay. Statistical significance was calculated by Student’s unpaired t-test; ***, p<0.01; **, p<0.05; *, p<0.1.

References

    1. Butt AM, Jones HC, Abbott NJ. Electrical resistance across the blood-brain barrier in anaesthetized rats: a developmental study. The Journal of physiology. 1990;429:47–62. - PMC - PubMed
    1. Pardridge WM. Blood-brain barrier drug targeting: the future of brain drug development. Molecular interventions. 2003;3:90–105. 151. - PubMed
    1. Weiss N, Miller F, Cazaubon S, Couraud PO. The blood-brain barrier in brain homeostasis and neurological diseases. Biochimica et biophysica acta. 2009;1788:842–857. - PubMed
    1. Deli MA, Abraham CS, Kataoka Y, Niwa M. Permeability studies on in vitro blood-brain barrier models: physiology, pathology, and pharmacology. Cellular and molecular neurobiology. 2005;25:59–127. - PMC - PubMed
    1. Syvanen S, et al. Species differences in blood-brain barrier transport of three positron emission tomography radioligands with emphasis on P-glycoprotein transport. Drug metabolism and disposition: the biological fate of chemicals. 2009;37:635–643. - PubMed

Publication types