. 2012 Jul;18(7):1095-101.
doi: 10.1038/nm.2793.

Matrix IGF-1 maintains bone mass by activation of mTOR in mesenchymal stem cells

Affiliations

Matrix IGF-1 maintains bone mass by activation of mTOR in mesenchymal stem cells

Lingling Xian et al. Nat Med. 2012 Jul.

Abstract

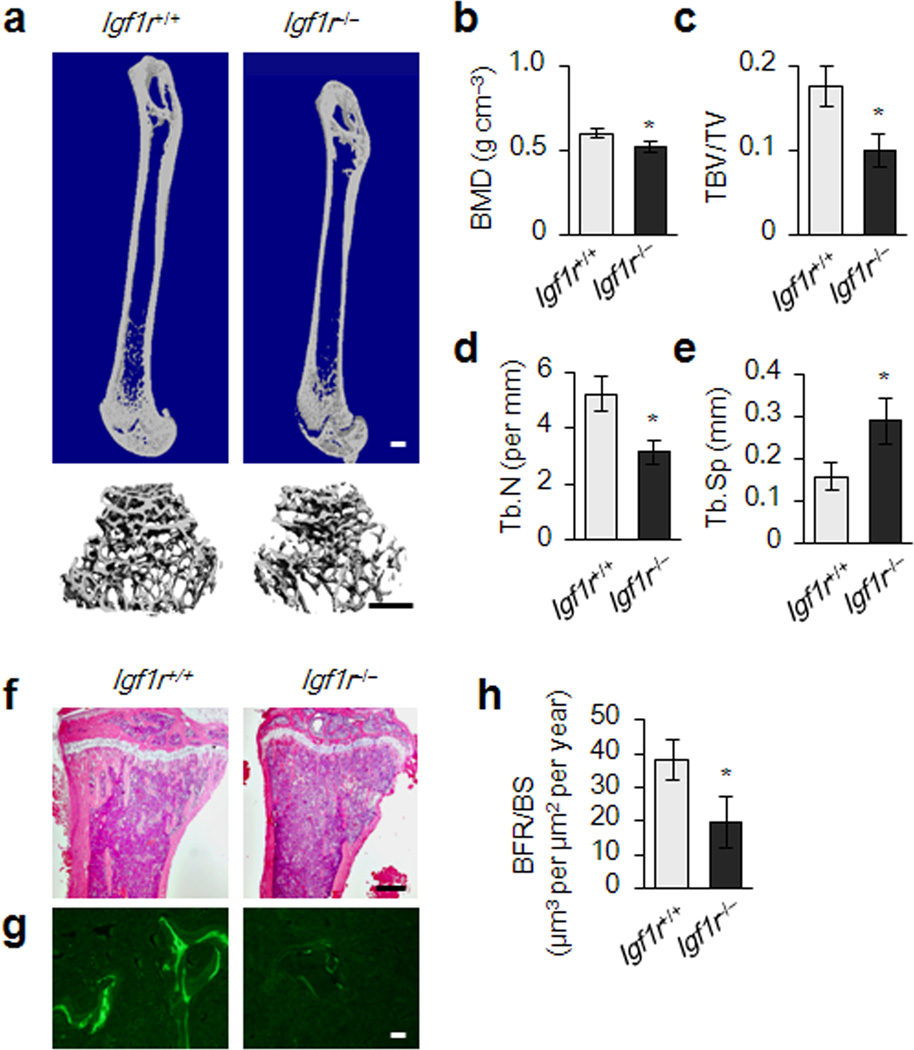
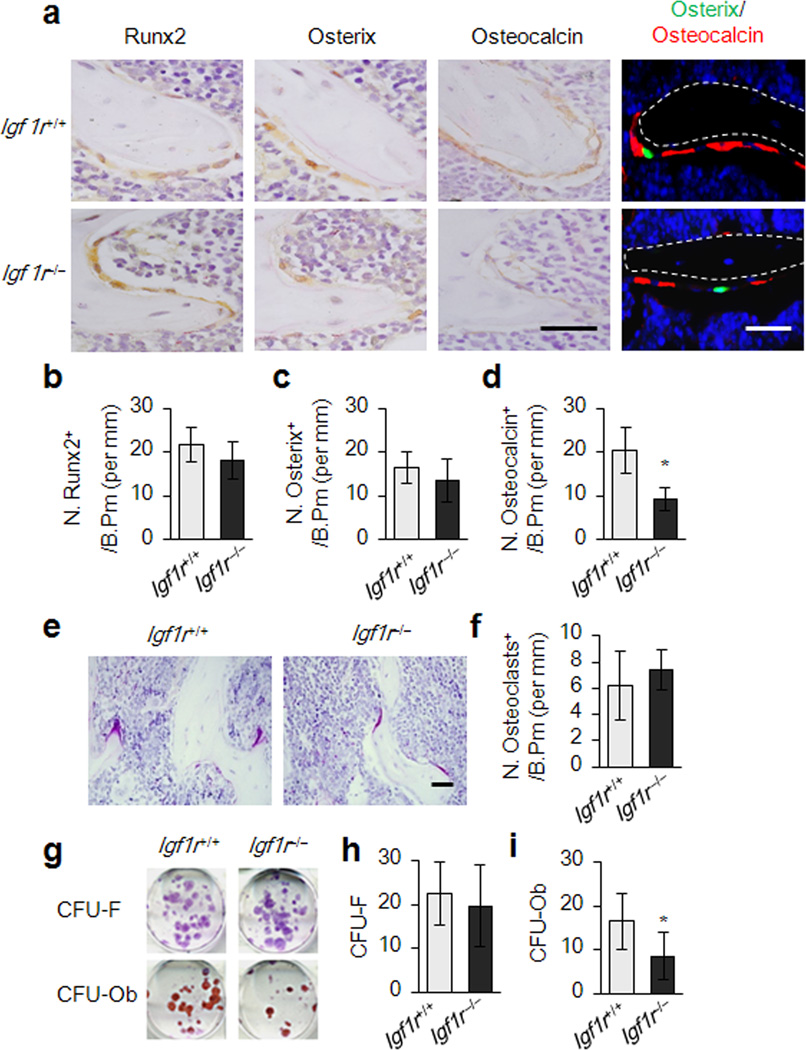
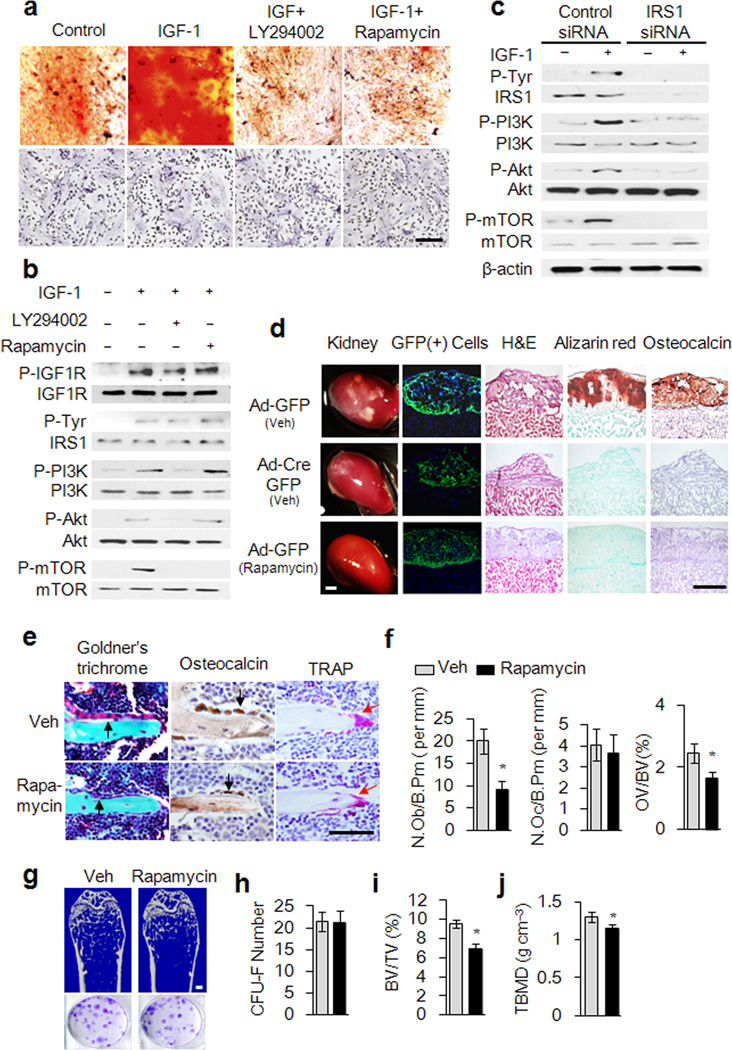
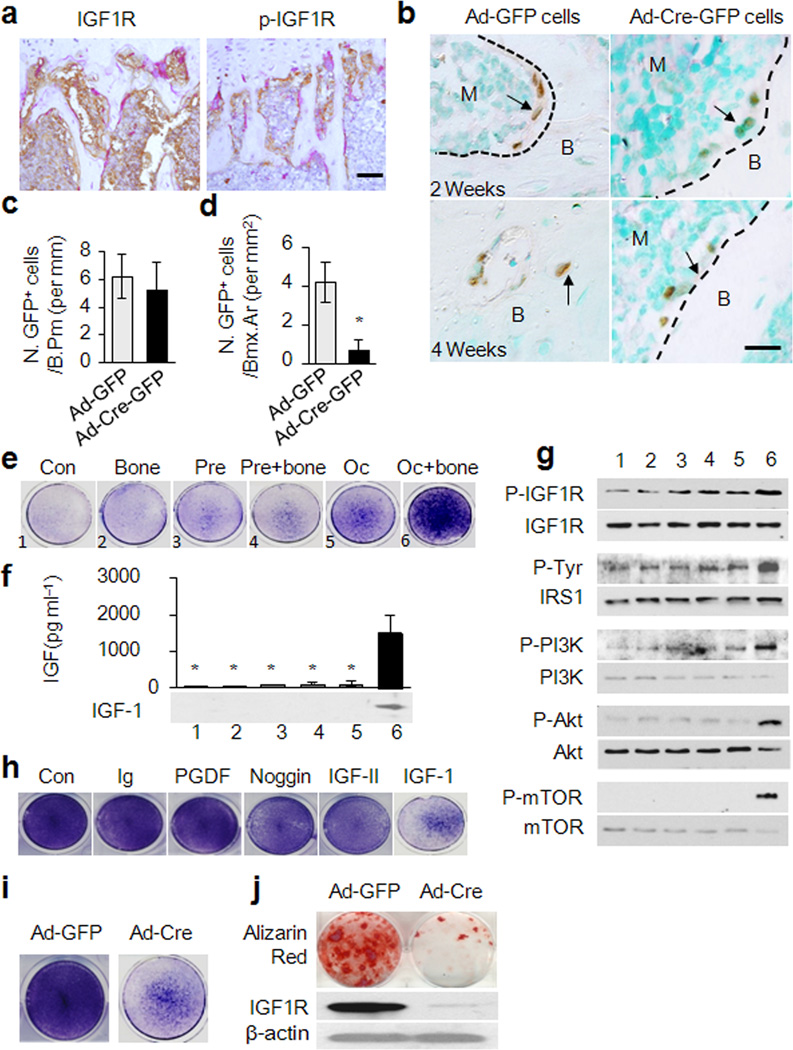
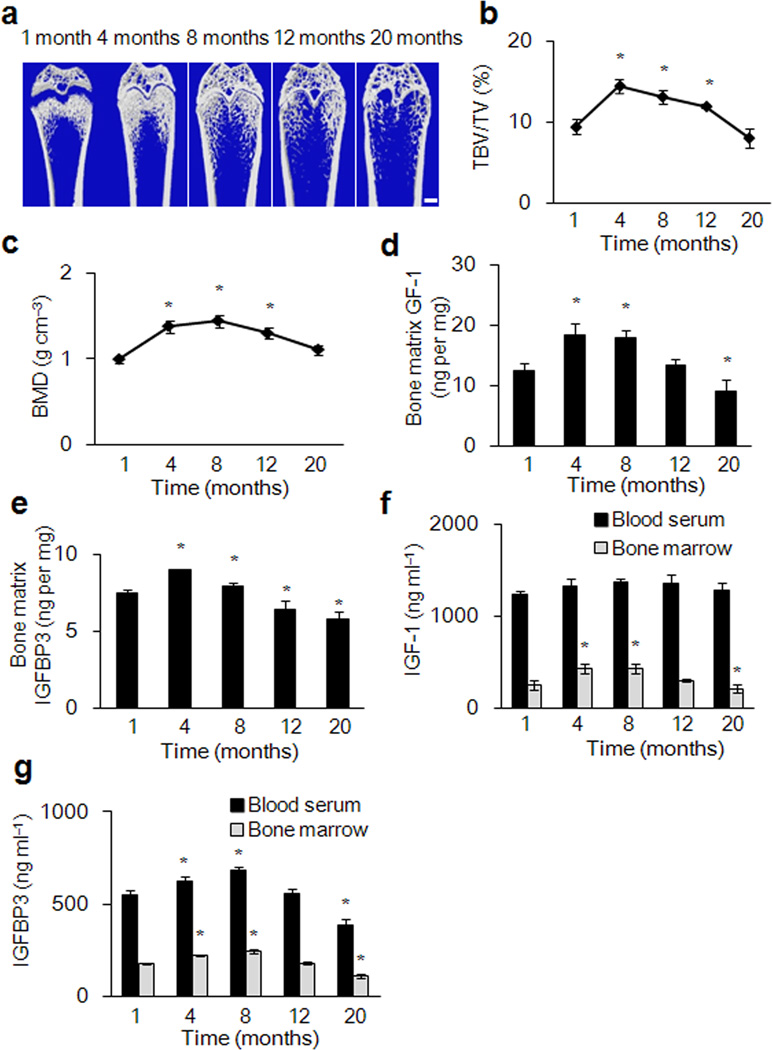
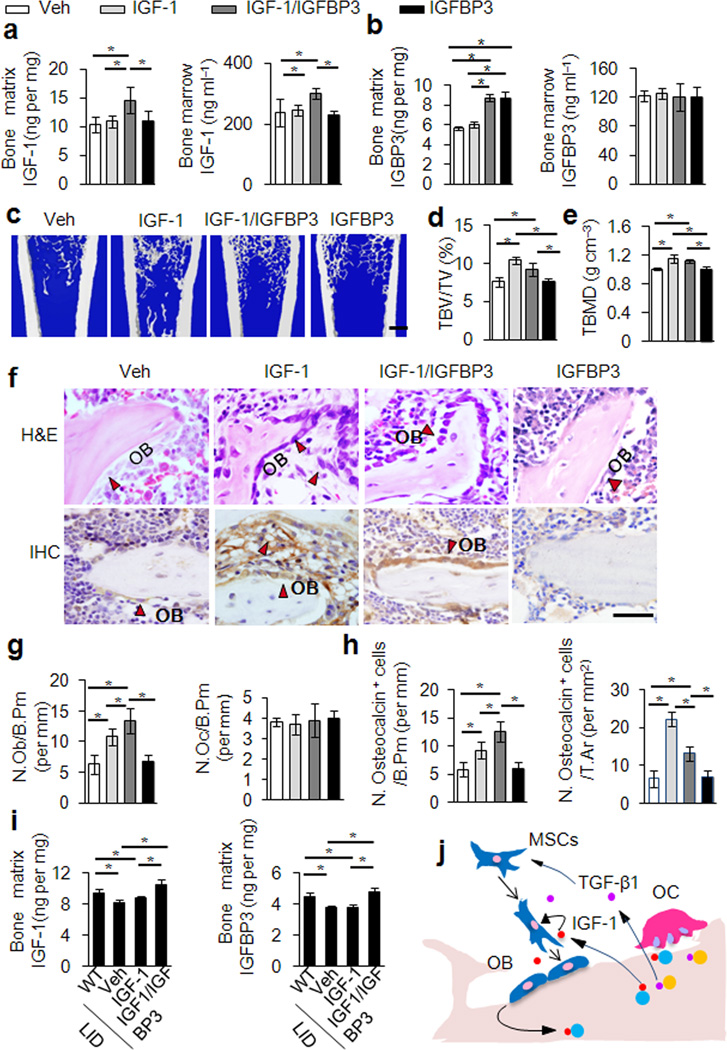
Insulin-like growth factor 1 (IGF-1), the most abundant growth factor in the bone matrix, maintains bone mass in adulthood. We now report that IGF-1 released from the bone matrix during bone remodeling stimulates osteoblastic differentiation of recruited mesenchymal stem cells (MSCs) by activation of mammalian target of rapamycin (mTOR), thus maintaining proper bone microarchitecture and mass. Mice with knockout of the IGF-1 receptor (Igf1r) in their pre-osteoblastic cells showed lower bone mass and mineral deposition rates than wild-type mice. Further, MSCs from Igf1rflox/flox mice with Igf1r deleted by a Cre adenovirus in vitro, although recruited to the bone surface after implantation, were unable to differentiate into osteoblasts. We also found that the concentrations of IGF-1 in the bone matrix and marrow of aged rats were lower than in those of young rats and directly correlated with the age-related decrease in bone mass. Likewise, in age-related osteoporosis in humans, we found that bone marrow IGF-1 concentrations were 40% lower in individuals with osteoporosis than in individuals without osteoporosis. Notably, injection of IGF-1 plus IGF binding protein 3 (IGFBP3), but not injection of IGF-1 alone, increased the concentration of IGF-1 in the bone matrix and stimulated new bone formation in aged rats. Together, these results provide mechanistic insight into how IGF-1 maintains adult bone mass, while also providing a further rationale for its therapeutic targeting to treat age-related osteoporosis.


Figures

Figure 1
Figure 1. Reduced bone formation during bone remodeling in Igf1r−/− (Osx-Cre; Igf1rfl/fl) mice
(a) Representative μCT images of femora from a 3-month-old female Igf1r−/− (Osx-Cre; Igf1rfl/fl) mouse and wild type littermate Igf1r+/+ mouse (Osx-Cre). Scale bars: 1 mm. (b–e) Quantitative μCT analysis of the secondary spongiosa of proximal tibiae. Volumetric bone mineral density (BMD) (b), trabecular bone volume fraction (TBV/TV) (c), trabecular number (Tb. N) (d), and trabecular separation (Tb. Sp) (e). (f) H&E histological sections of tibiae from 3-month-old Igf1r+/+ and Igf1r−/− mice. Scale bar: 1 mm. (g) Calcein double labeling of the metaphyseal trabecular bone at distal femora (Scale bar: 1 mm). (h) Bone formation rate per bone surface (BFR/BS). Data represent the mean ± SEM. n = 10. *p < 0.05.
Figure 2
Figure 2. Suppressed osteoblast maturation in Igf1r−/− (Osx-Cre; Igf1rfl/fl) mice
(a) Immunohistochemical analysis of Runx2, Osterix, and Osteocalcin performed on trabecular bone sections from distal femora of 3-month-old female Igf1r−/− (Osx-Cre; Igf1rfl/fl) mouse and wild type littermate mouse Igf1r+/+ (Osx-Cre). Osx-GFP expressing cells observed by direct fluorescence microscopy appear green, immunofluorencent staining for osteocalcin visualize red (far right panel). Scale bar: 100 µm. (b–d) Numbers of Runx2, Osterix, and Osteocalcin positive cells on bone surface, measured as cells per millimeter of perimeter in sections. n = 5. *p < 0.05. (e,f) Light micrographs of tartrate-resistant acid phosphatase (TRAP)-staining performed on trabecular bone sections from distal femora of mice. Number of osteoclasts per tissue area (N.Oc/T,Ar) was measured. Data represent the mean ± SEM. n = 10. *p < 0.05. (Scale bar: 100 µm) (g) CFU-F and CFU-Ob assays from harvested bone marrow of the mice as indicated. Representative images of CFU-Fs stained with crystal violet (top panels). Representative images of CFU-Obs stained with Alizarin Red (bottom panels). (h,i) Quantifications of the CFU-F and CFU-Ob assays. Data represent the mean ± SEM. of triplicate cultures of bone marrow nucleated cells pooled from five individual mice. *p < 0.05.
Figure 3
Figure 3. IGF-1 induces osteoblastic differentiation of MSCs through the IRS-PI3K-Akt-mTOR pathway
(a) Alizarin red staining showing Osteoblastic differentiation of Sca-1+ MSCs induced by IGF-1 as indicated (top panels). Alive cells number was determined by hematoxylin staining (bottom panels). Scale bar: 100 µm. (b) Western blot analysis of IGF-1 induced phosphorylation of IGF1R, IRS1, PI3K, Akt, and mTOR in Sca-1+ MSCs treated with IGF-1 (20 ng ml−1) or vehicle in the presence or absence of LY294002 (10 µM) or rapamycin (20 nM) for 15 minutes as indicated. (c) Western blot analysis of IGF-1-induced phosphorylation of IRS1, PI3K, Akt, and mTOR in Sca-1+ MSCs treated by IGF-1 after transfected with Irs1 siRNA or control siRNA. (d) IGF-1 induced Sca-1+ MSCs differentiation underneath renal capsules. The renal sections were analyzed by direct GFP fluorescence visualization, H&E staining, Alizarin red staining or immunohistology for osteocalcin. Scale bar: 100 µm. (e–g) Rapamycin impairs trabecular bone formation. Representative images of mouse distal femora sections with staining of Golder’s Trichrome, osteocalcin or TRAP (e). Scale bar: 100 µm. Histomorphometric analysis of remodeling trabecular bone after treated with rapamycin: number of osteoblast per bone perimeter (f left), number of osteoclast per bone perimeter (f center), Osteoid volume/bone volume (f right), μCT Representative images of distal femora (g top), Scale bar: 1 mm. CFU-F assays (g,h), trabecular bone volume fraction (TBV/TV) (i) trabecular bone mineral density (TBMD) (j). Data represent the mean ± SEM. n = 5. *p < 0.05.
Figure 4
Figure 4. Osteoclastic bone resorption-conditioned medium (BRCM) induces osteogenic differentiation of MSCs
(a) Immunohistochemical analysis of the trabecular bone sections of mouse distal femora with antibodies against IGF1R (Left) and p-IGF1R (Right). Scale bar: 200 µm. (b) Immunohistochemical analysis of femora sections of 3 months old mice transplanted with GFP-labeled mouse MSCs with GFP antibody. Scale bar: 100 µm. (c,d) Quantification of GFP+ cells on bone surface 2 weeks after transplantation or in bone matrix 4 weeks after transplantation. n=5. *p< 0.05. (e) ALP staining for the differentiation potential of MSCs cultured in various conditioned media as indicated. 1-medium only, 2-Bone slice only, 3-Osteoclast precursor culture, 4-Osteoclast precursors cultured with bone slice, 5-Osteoclast culture, 6-Osteoclasts cultured with bone. (f) ELISA analysis of IGF-1 levels in BRCM. n = 3. *p < 0.05 versus Oc+ bone group. (g) Western blot analysis of the effect of various condition media on phosphorylation of IGF1R, IRS1, PI3K, Akt, and mTOR in MSCs. (h) ALP staining for the differentiation potential of MSCs cultured in BRCM with addition of individual neutralizing antibodies (Ab) or noggin, as indicated. (i) ALP staining and (j) Alizarin red staining for the effect of BRCM on differentiation potential of Sca-1+ MSCs isolated from Igf1rfl/fl by infection with adenovirous-Cre (Ad-Cre-GFP) or Ad-GFP (j, top). Western blot analysis of IGF1R in MSCs (j, bottom).
Figure 5
Figure 5. Analysis of IGF-1 and IGFBP3 levels in blood, bone marrow and bone matrix in relation to bone mass during aging of rats
(a) Representative μCT images of distal femora from rats of 1, 4, 8, 12, and 20 months. Scale bars: 1 mm. (b, c) Quantitative μCT analysis of the distal femur. trabecular bone volume fraction (TBV/TV) (b)Trabecular bone mineral density (BMD) (c). (d) IGF-1 concentrations in bone matrix extraction. (e) IGFBP3 concentration in bone matrix extraction. (f, g) Levels of IGF-1(f) and IGFBP3 (g) in bone marrow and peripheral blood serum at different ages. Data represent mean ± SEM of triplicate repeat for each sample and 10 individual rats for each time point. *p < 0.05 versus 1 month group.
Figure 6
Figure 6. Increase of IGF-1 in the bone matrix attenuates bone loss
(a,b) IGF-1 and IGFBP3 concentrations in bone matrix extraction (a and b left) and bone marrow (a and b right) of 20 months old rats locally injected with vehicle (Veh), IGF-1, IGF-1 plus IGFBP3 (IGF-1/IGFBP3) or IGFBP3 only. (c) Representative images of three dimensional μCT of distal femora injected with Veh, IGF-1, IGF-1/IGFBP3 or IGFBP3. Scale bar: 1 mm. (d,e) Quantitative μCT analysis of the distal femora. trabecular bone volume fraction (TBV/TV) (d), Trabecular volumetric bone mineral density (TBMD) (e). (f) H&E (top) and immunostaining for osteocalcin (bottom) of femur sections from the rats with indicated injection. Osteoblast cells are shown with red arrows. Scale bar: 100 µm. (g) Number of osteoblasts (left) and osteoclasts (right) of remodeling trabecular bone quantified by histomorphometric analysis. (h) Quantification of osteocalcin-positive cells on bone surface (left) and in total tissue area (right (i) Concentrations of IGF-1 (left) and IGFBP3 (right) in bone matrix extraction of LID mice or their littermates infused with Veh, IGF-1 only or IGF-1 plus IGFBP3 by osmotic pumps. All data represent the mean ± SEM. n = 10. *p < 0.05 (j) Schematic diagram of bone matrix IGF-1 induced osteoblast differentiation of MSCs during bone remodeling. TGF-β1 recruits MSCs to the bone resorptive site in response to osteoclastic bone resorption, and IGF-1 released from bone matrix comprises the osteogenic microenvironment for differentiation of recruited MSCs.

Comment in

References

    1. Rizzoli R, Bianchi ML, Garabedian M, McKay HA, Moreno LA. Maximizing bone mineral mass gain during growth for the prevention of fractures in the adolescents and the elderly. Bone. 2010;46:294–305. - PubMed
    1. Schettler AE, Gustafson EM. Osteoporosis prevention starts in adolescence. J. Am. Acad. Nurse Pract. 2004;16:274–282. - PubMed
    1. Teitelbaum SL. Bone resorption by osteoclasts. Science. 2000;289:1504–1508. - PubMed
    1. Zaidi M. Skeletal remodeling in health and disease. Nat. Med. 2007;13:791–801. - PubMed
    1. Agnusdei D, Gentilella R. GH and IGF-I as therapeutic agents for osteoporosis. J. Endocrinol. Invest. 2005;28:32–36. - PubMed

Publication types

MeSH terms

Substances