. 2012 Sep;78(17):6103-12.
doi: 10.1128/AEM.01245-12. Epub 2012 Jun 22.

Alternative approach to modeling bacterial lag time, using logistic regression as a function of time, temperature, pH, and sodium chloride concentration

Affiliations

Alternative approach to modeling bacterial lag time, using logistic regression as a function of time, temperature, pH, and sodium chloride concentration

Shige Koseki et al. Appl Environ Microbiol. 2012 Sep.

Abstract

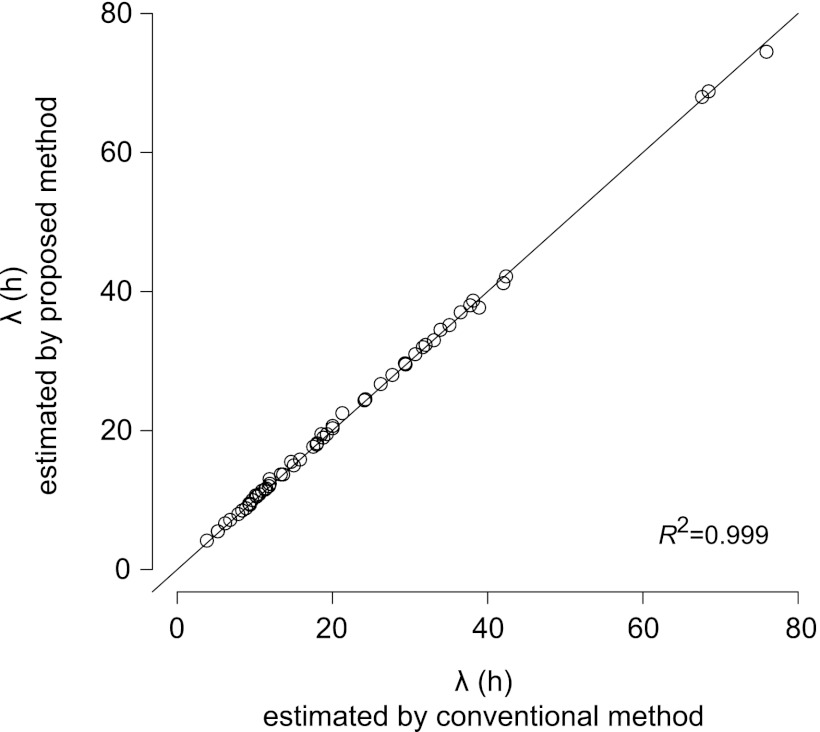
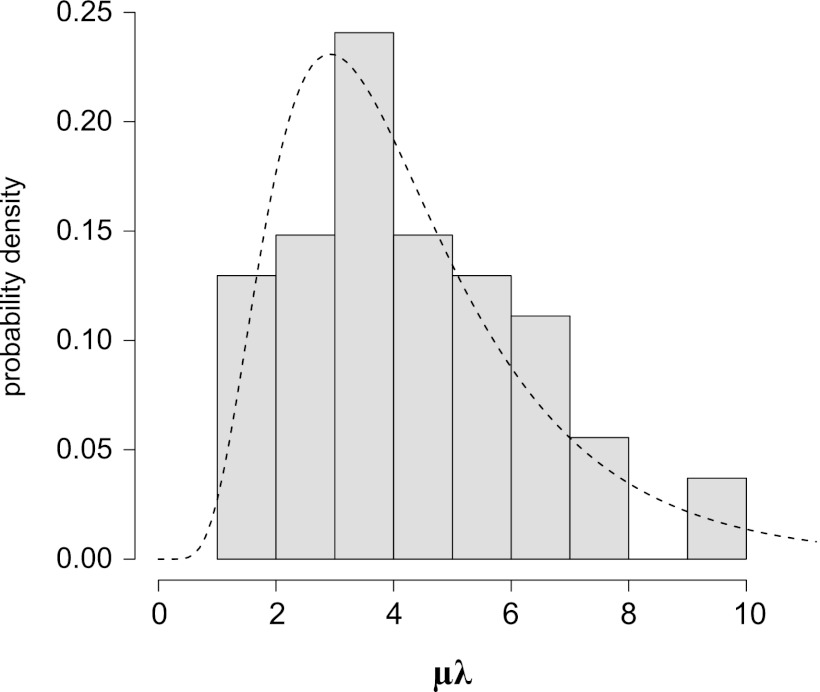
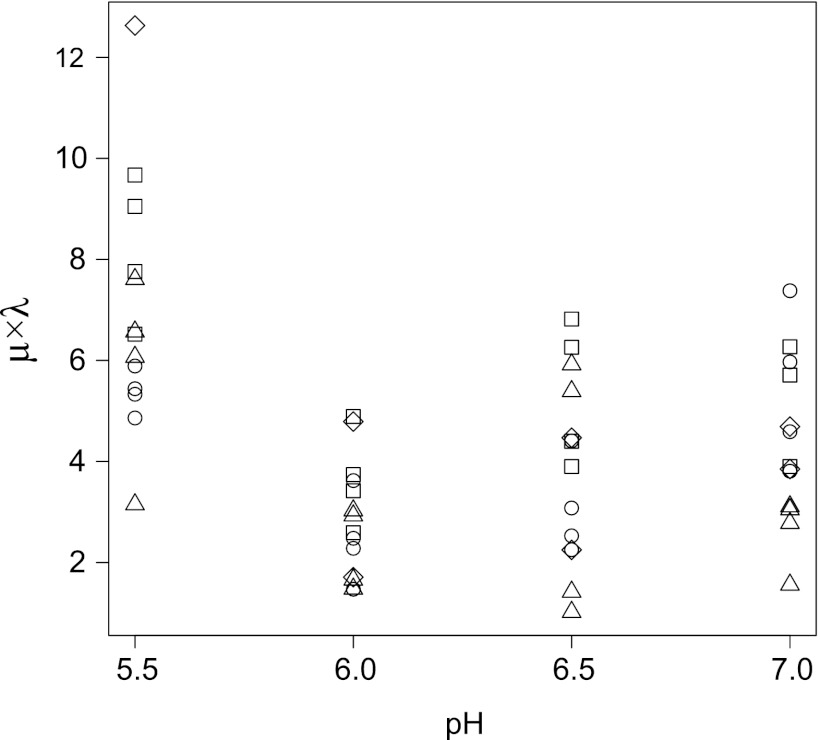
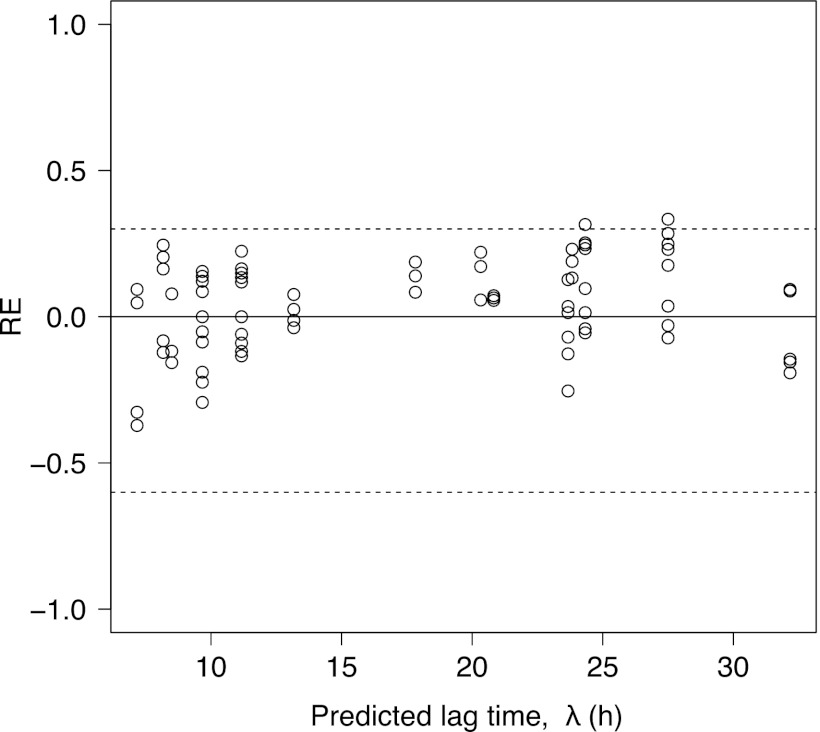
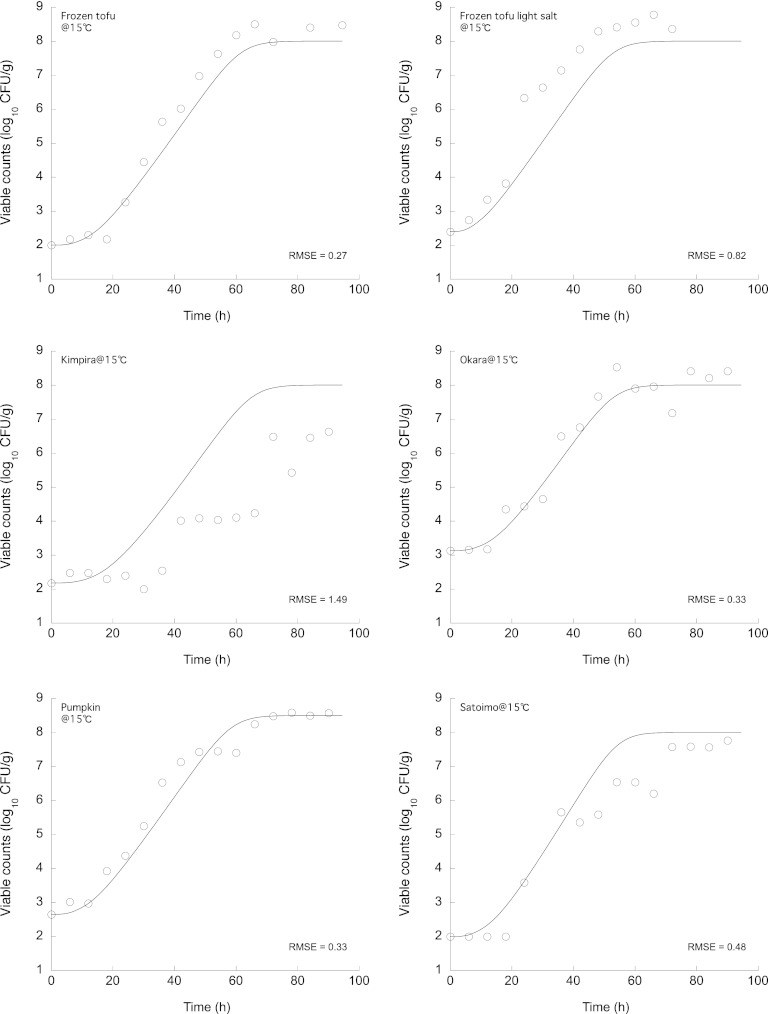
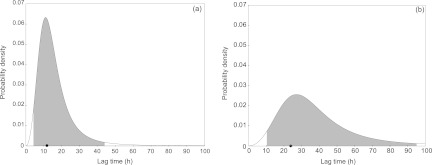
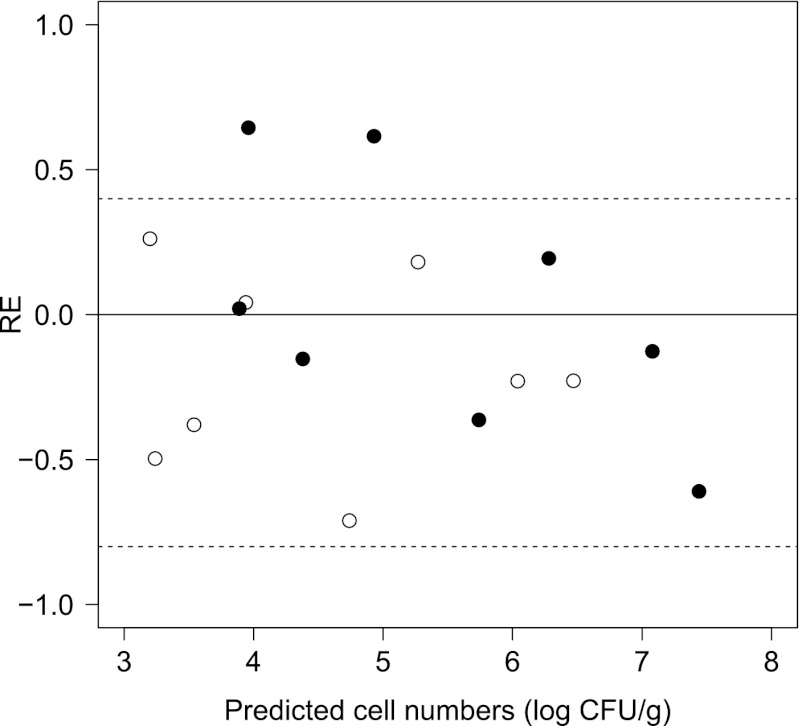
The objective of this study was to develop a probabilistic model to predict the end of lag time (λ) during the growth of Bacillus cereus vegetative cells as a function of temperature, pH, and salt concentration using logistic regression. The developed λ model was subsequently combined with a logistic differential equation to simulate bacterial numbers over time. To develop a novel model for λ, we determined whether bacterial growth had begun, i.e., whether λ had ended, at each time point during the growth kinetics. The growth of B. cereus was evaluated by optical density (OD) measurements in culture media for various pHs (5.5 ∼ 7.0) and salt concentrations (0.5 ∼ 2.0%) at static temperatures (10 ∼ 20°C). The probability of the end of λ was modeled using dichotomous judgments obtained at each OD measurement point concerning whether a significant increase had been observed. The probability of the end of λ was described as a function of time, temperature, pH, and salt concentration and showed a high goodness of fit. The λ model was validated with independent data sets of B. cereus growth in culture media and foods, indicating acceptable performance. Furthermore, the λ model, in combination with a logistic differential equation, enabled a simulation of the population of B. cereus in various foods over time at static and/or fluctuating temperatures with high accuracy. Thus, this newly developed modeling procedure enables the description of λ using observable environmental parameters without any conceptual assumptions and the simulation of bacterial numbers over time with the use of a logistic differential equation.


Figures

Fig 1
Fig 1
Relationship of the estimated lag times between the conventional curve fitting procedure (8) and the method employed in the present study.
Fig 2
Fig 2
Distribution of the product of estimated specific growth rate (μmax) and lag time (λ). The dotted line is a fitted probability distribution as a function of log-normal (mean = 1.34, standard deviation = 0.52).
Fig 3
Fig 3
pH and/or NaCl dependency of the μmaxλ. □, 0.5% NaCl; ○, 1.0% NaCl; △, 1.5% NaCl; □, 2.0% NaCl.
Fig 4
Fig 4
Representative changes in the probability of the end of lag time at pH 6.0 and 0.5% NaCl. (a) The cumulative probability distribution predicted by equation 11 (solid lines) and equation 12 (dashed lines). (b) Probability density distributions calculated by differentiation of equation 11 (solid lines) and equation 12 (dashed lines).
Fig 5
Fig 5
Relative error (RE) plots comparing the observed and predicted values (at P = 0.5) of the lag time of B. cereus fitted by equation 9. The dotted lines represent the acceptable prediction zone for an RE of −0.6 (fail-safe) to 0.3 (fail-dangerous).
Fig 6
Fig 6
Experimentally observed changes in the number of B. cereus cells on Japanese deli foods and the growth prediction calculated using equation 13 at 10°C.
Fig 7
Fig 7
Experimentally observed changes in the number of B. cereus cells on Japanese deli foods and the growth prediction calculated using equation 13 at 15°C.
Fig 8
Fig 8
Probability density distributions of the end of lag time for cooked okara at 15°C (a) and 10°C (b) derived using the differentiation of equation 11. The shaded area represents the 95% prediction interval, and the filled circle represents the observed lag time estimated by using DMFit software.
Fig 9
Fig 9
(a) Experimentally observed changes in the number of B. cereus cells in cream pasta sauces and the growth prediction under fluctuating temperatures calculated using equation 13. The dotted line represents changes in temperature. Filled and open circles represent the observed B. cereus number (log CFU/g) in sauces I (pH 6.20, 1.05% NaCl) and II (pH 5.95, 1.59% NaCl), respectively. The dashed and solid lines represent model predictions for sauces I and II, respectively. The root mean squared errors for sauces I and II were 0.17 and 0.18, respectively. (b) Probability of the end of lag time corresponding to temperature changes. The dotted line represents changes in temperature. The dashed and solid lines represent model predictions for sauces I and II, respectively.
Fig 10
Fig 10
Relative error (RE) plots comparing the observed and predicted values of the number of B. cereus cells calculated by equation 13 under fluctuating temperature conditions. The dotted lines represent the acceptable prediction zone for an RE of −0.8 (fail-safe) to 0.4 (fail-dangerous). Filled and open circles represent the results for sauces I (pH 6.20, 1.05% NaCl) and II (pH 5.95, 1.59% NaCl), respectively.

References

    1. Agresti A. 2007. An introduction to categorical data analysis, 2nd ed. John Wiley & Sons, Inc., Hoboken, NJ
    1. Augustin J-C, Carlier V. 2000. Mathematical modelling of the growth rate and lag time for Listeria monocytogenes. Int. J. Food Microbiol. 56: 29–51 - PubMed
    1. Baranyi J, Pin C. 1999. Estimating bacterial growth parameters by means of detection times. Appl. Environ. Microbiol. 65: 732–736 - PMC - PubMed
    1. Baranyi J, Roberts T. 1994. A dynamic approach to predicting bacterial-growth in food. Int. J. Food Microbiol. 23: 277–294 - PubMed
    1. Biesta-Peters EG, Reij MW, Joosten H, Gorris LGM, Zwietering MH. 2010. Comparison of two optical-density-based methods and a plate count method for estimation of growth parameters of Bacillus cereus. Appl. Environ. Microbiol. 76: 1399–1405 - PMC - PubMed

Substances

LinkOut - more resources