Uncrossing the U.S black-white mortality crossover: the role of cohort forces in life course mortality risk
- PMID: 22729715
- PMCID: PMC5892416
- DOI: 10.1007/s13524-012-0107-y
Uncrossing the U.S black-white mortality crossover: the role of cohort forces in life course mortality risk
Abstract
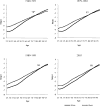
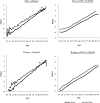
In this article, I examine the black-white crossover in U.S. adult all-cause mortality, emphasizing how cohort effects condition age-specific estimates of mortality risk. I employ hierarchical age-period-cohort methods on the National Health Interview Survey-Linked Mortality Files between 1986 and 2006 to show that the black-white mortality crossover can be uncrossed by factoring out period and cohort effects of mortality risk. That is, when controlling for variations in cohort and period patterns of U.S. adult mortality, the estimated age effects of non-Hispanic black and non-Hispanic white U.S. adult mortality risk do not cross at any age. This is the case for both men and women. Further, results show that nearly all the recent temporal change in U.S. adult mortality risk was cohort driven. The findings support the contention that the non-Hispanic black and non-Hispanic white U.S. adult populations experienced disparate cohort patterns of mortality risk and that these different experiences are driving the convergence and crossover of mortality risk at older ages.
Figures


References
-
- Arias E. National Vital Statistics Reports. 14. Vol. 54. Hyattsville, MD: National Center for Health Statistics; 2006. United States life tables, 2003. - PubMed
-
- Ben-Shlomo Y, Kuh D. A life course approach to chronic disease epidemiology: Conceptual models, empirical challenges and interdisciplinary perspectives. International Journal of Epidemiology. 2002;31:285–293. - PubMed
-
- Blackwell D, Hayward M, Crimmins E. Does childhood health affect chronic morbidity in later life? Social Science & Medicine. 2001;52:1269–1284. - PubMed
-
- Coale AJ, Kisker EE. Mortality crossovers: Reality or bad data? Population Studies. 1986;40:389–401.
-
- Cutler DM, Miller G. The role of public health improvements in health advances: The twentieth century United States. Demography. 2005;42:1–22. - PubMed
Publication types
MeSH terms
Grants and funding
LinkOut - more resources
Full Text Sources

