. 2012 Aug 24;287(35):29690-701.
doi: 10.1074/jbc.M111.338095. Epub 2012 Jun 22.

Interactions between the NO-citrulline cycle and brain-derived neurotrophic factor in differentiation of neural stem cells

Affiliations

Interactions between the NO-citrulline cycle and brain-derived neurotrophic factor in differentiation of neural stem cells

Claudiana Lameu et al. J Biol Chem. .

Abstract

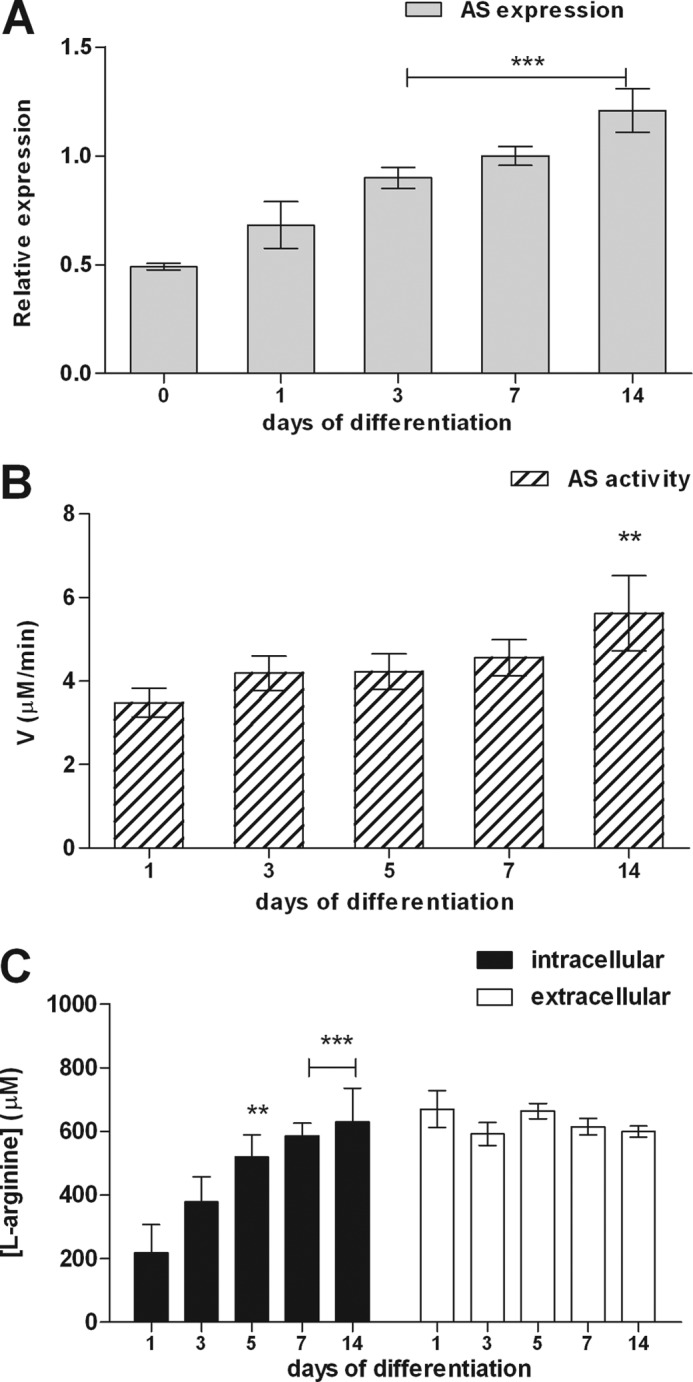
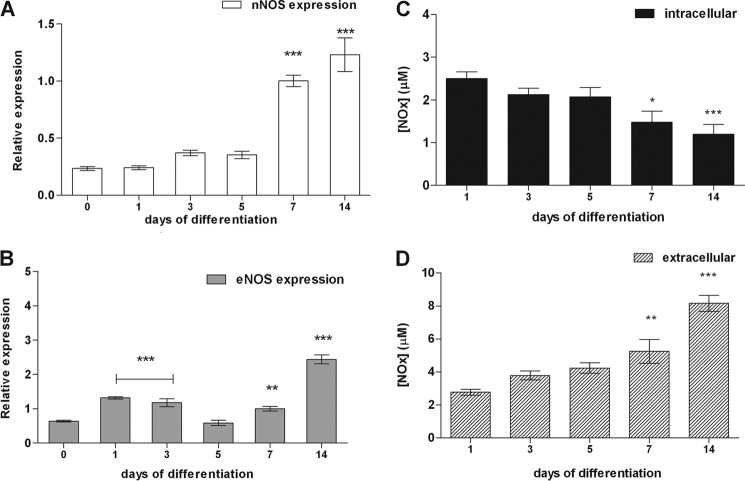
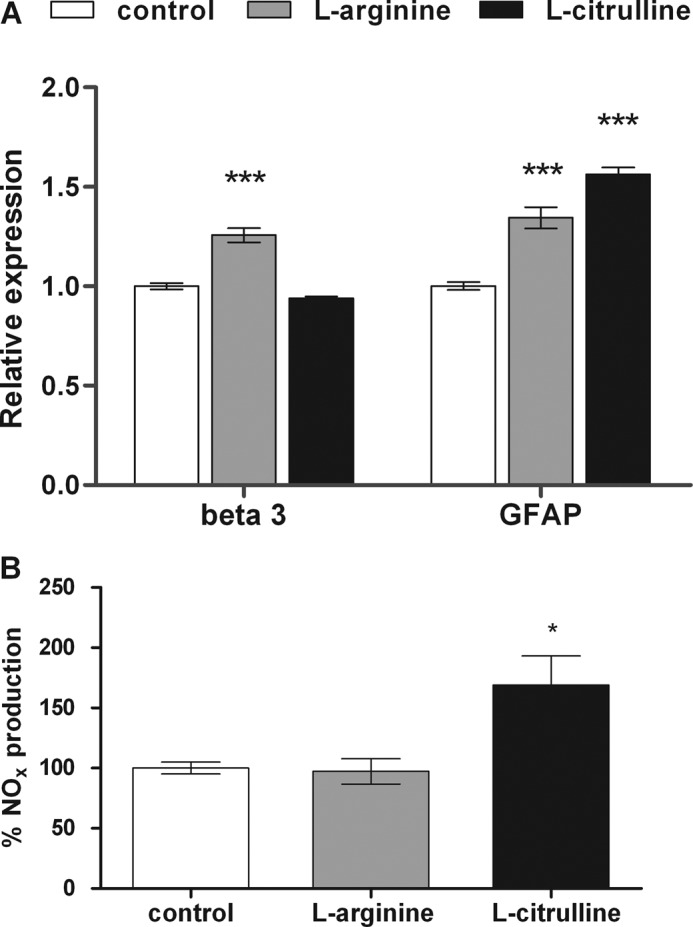
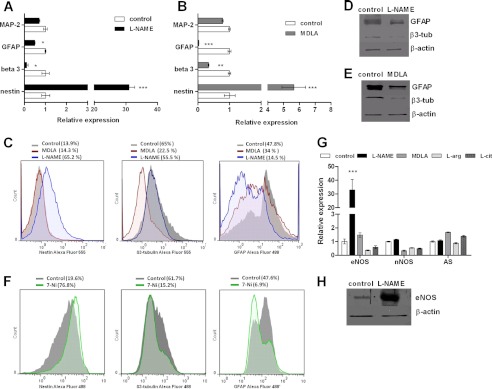
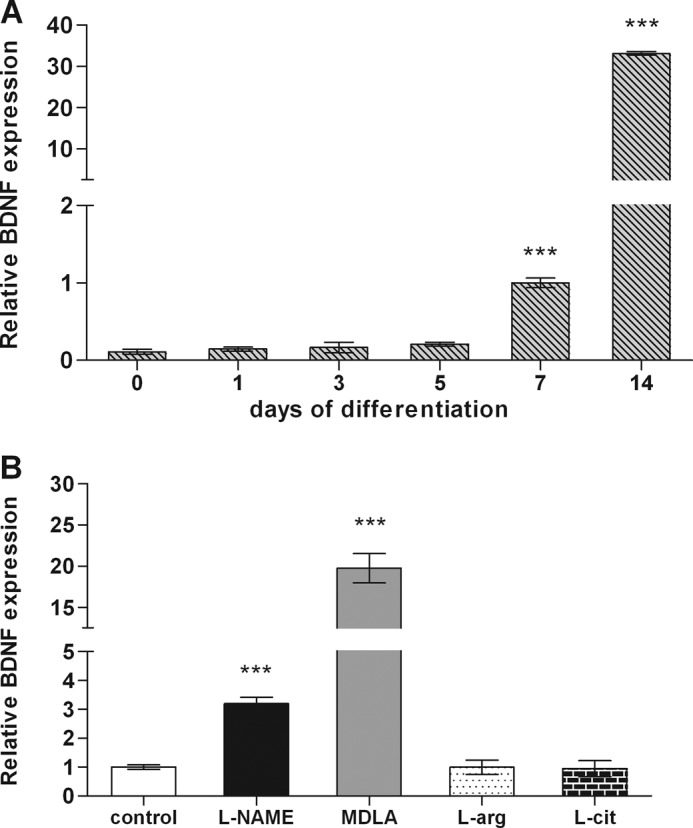
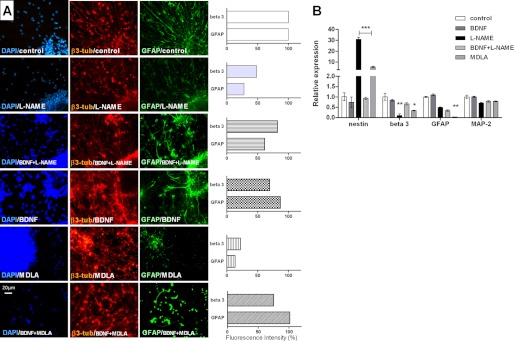
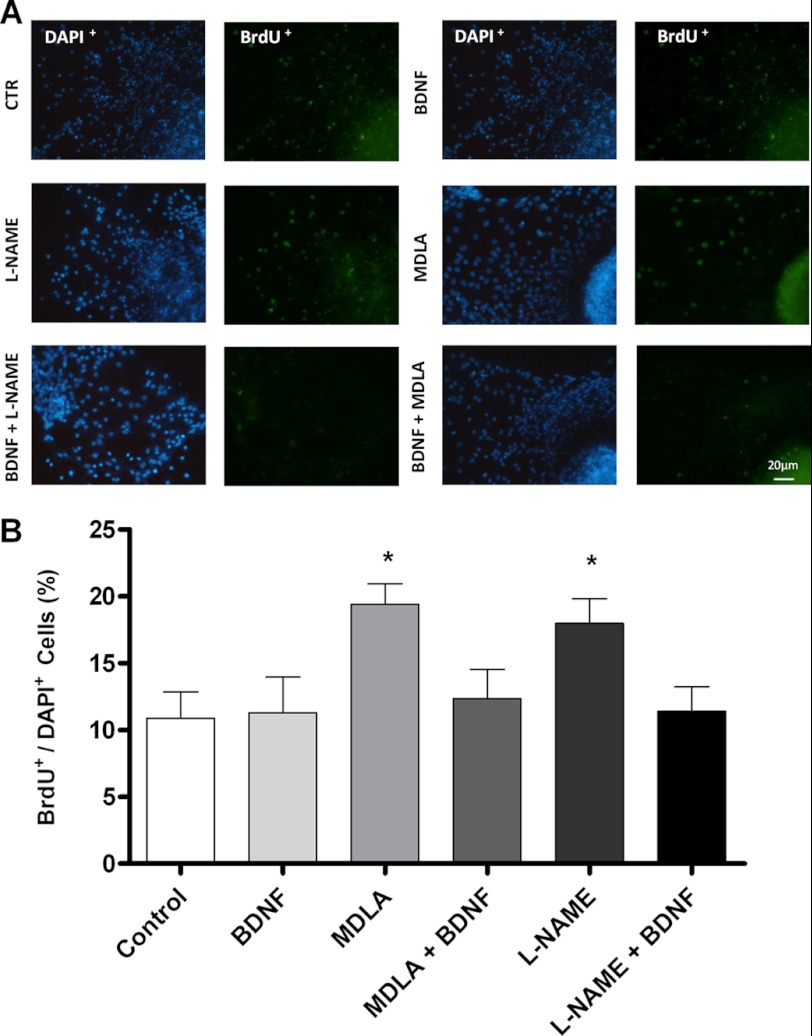
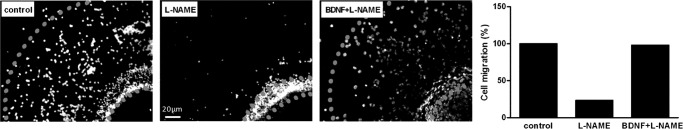
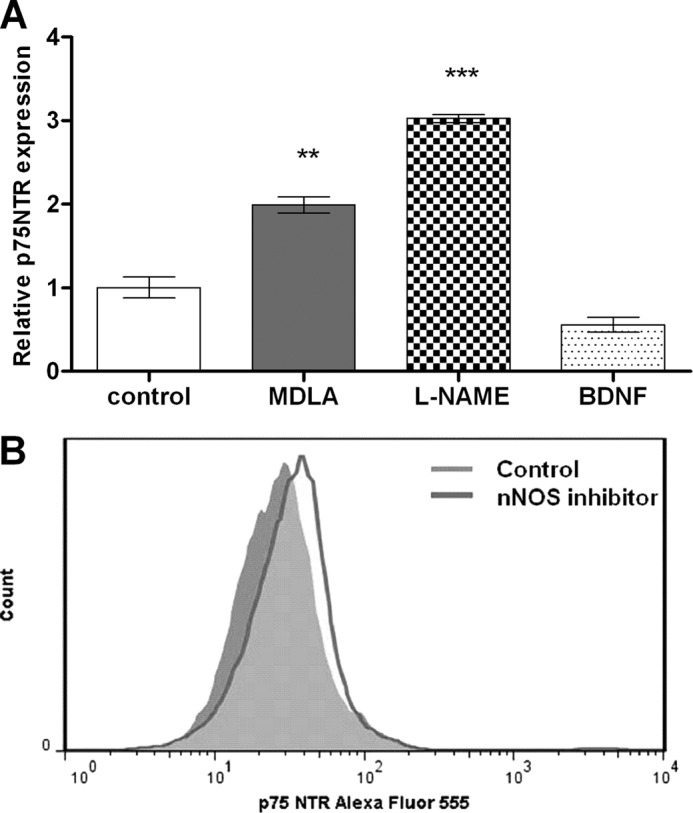
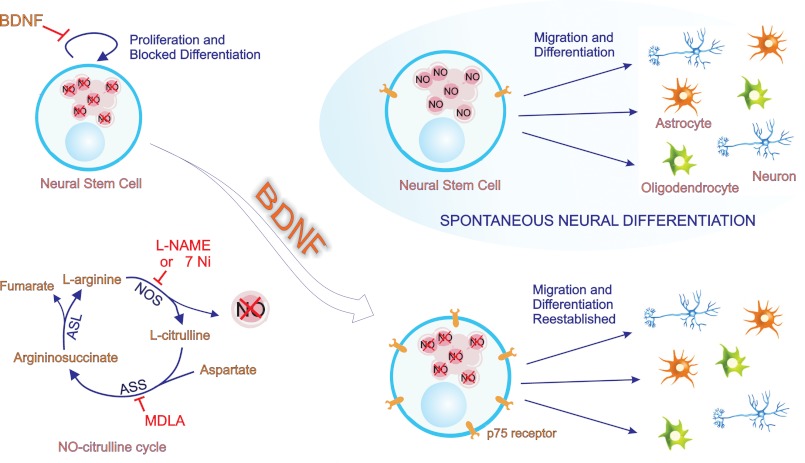
The diffusible messenger NO plays multiple roles in neuroprotection, neurodegeneration, and brain plasticity. Argininosuccinate synthase (AS) is a ubiquitous enzyme in mammals and the key enzyme of the NO-citrulline cycle, because it provides the substrate L-arginine for subsequent NO synthesis by inducible, endothelial, and neuronal NO synthase (NOS). Here, we provide evidence for the participation of AS and of the NO-citrulline cycle in the progress of differentiation of neural stem cells (NSC) into neurons, astrocytes, and oligodendrocytes. AS expression and activity and neuronal NOS expression, as well as l-arginine and NO(x) production, increased along neural differentiation, whereas endothelial NOS expression was augmented in conditions of chronic NOS inhibition during differentiation, indicating that this NOS isoform is amenable to modulation by extracellular cues. AS and NOS inhibition caused a delay in the progress of neural differentiation, as suggested by the decreased percentage of terminally differentiated cells. On the other hand, BDNF reversed the delay of neural differentiation of NSC caused by inhibition of NO(x) production. A likely cause is the lack of NO, which up-regulated p75 neurotrophin receptor expression, a receptor required for BDNF-induced differentiation of NSC. We conclude that the NO-citrulline cycle acts together with BDNF for maintaining the progress of neural differentiation.


Figures

FIGURE 1.
FIGURE 1.
Expression and activity of AS along neural differentiation. A, AS gene expression in neurospheres was determined by real time PCR. Normalization of expression levels was done by comparison with GAPDH RNA transcription levels as internal standard for gene expression. B, determination of AS enzymatic activity of neurospheres along differentiation using a colorimetric assay. C, quantification of intra- and extracellular l-arginine levels during neurosphere differentiation. Cell culture supernatants and intracellular contents were collected and analyzed for l-arginine by HPLC. The experimental data are presented as the mean values ± S.E. **, p < 0.01; ***, p < 0.001, compared with control data collected on day 0 or 1 of differentiation.
FIGURE 2.
FIGURE 2.
Gene expression of eNOS and nNOS and NO metabolite (NOx) production along neurosphere differentiation. A and B, nNOS (A) and eNOS (B) gene expression changes in neurospheres cultures from days 0–14 following induction to neural differentiation were analyzed by real time PCR. Normalization of expression levels was done by comparison to GAPDH gene expression. The data are shown as the mean values ± S.E. of three independent experiments. C and D, cells in differentiation were lysed with radioimmune precipitation assay buffer for measuring NOx contents in intracellular (C) and extracellular media (D) by a chemiluminescence assay. The culture medium of neurospheres was changed 1 day before the collection of intra- and extracellular media. The values of concentration of NOx in the basal media used for measurement of nitric oxide were subtracted from the samples collected during NSC differentiation. In addition, we have normalized the production of these metabolites to the protein concentration of the culture. NO concentrations are expressed as mean values ± S.E. of six independent experiments. *, p < 0.01; **, p < 0.01; ***, p < 0.001, compared to control data collected on days 0 or 1 of differentiation.
FIGURE 3.
FIGURE 3.
Interference of NO-citrulline cycle intermediates with neurosphere differentiation. A, relative gene expression of specific markers for differentiating neurons (β3-tubulin abbreviated as beta) and glia (GFAP) of l-arginine- or l-citrulline-treated neurospheres on day 7 of differentiation were determined by real time PCR. Neurospheres were maintained in culture until day 7 of differentiation in the presence of 1 mm l-arginine, a natural NOS substrate, or 1 mm l-citrulline, an AS substrate, which were newly supplied every day. The culture medium was changed every 2 days. Nontreated differentiated cells were used as control. B, NO production of neurospheres differentiated in the absence or presence of l-arginine- or l-citrulline on day 7 was measured by a chemiluminescence assay as described under “Experimental Procedures.” NO production of nontreated cells was considered as 100%. The shown data are mean values ± S.E. *, p < 0.05; ***, p < 0.001, compared to control data.
FIGURE 4.
FIGURE 4.
Interference of NO inhibition with neurosphere differentiation. A and B, gene expression levels of specific markers for mature neurons (MAP-2), glia (GFAP), differentiating neurons (β3-tubulin), and progenitor cells (nestin) of l-NAME-treated (A) and MDLA-treated (B) neurospheres on day 7 of differentiation were determined by real time PCR. Neurospheres were maintained in culture until day 7 of differentiation in the absence or presence of 1 mm l-NAME, a nonselective antagonist of NOS, or 1 mm MDLA, an inhibitor of AS, which were newly supplied every day. The medium was changed every 2 days. Cells differentiated in the absence of these compounds were used as control. C, flow cytometry analysis of Nestin, β3-tubulin, and GFAP expression in neurospheres differentiated for 7 days in the absence or presence of 1 mm MDLA or 1 mm l-NAME. Representative histograms compare expression levels of neural markers in differentiated neurospheres (gray) with neurospheres treated with MDLA (red) or l-NAME (blue). D and E, immunoblots of protein extracts from NSC on day 7 of differentiation cultures in the absence or presence of 1 mm l-NAME (D) or 1 mm MDLA (E) were probed for GFAP and β3-tubulin expression levels. F, flow cytometry analysis of Nestin, β3-tubulin, and GFAP expression in murine neurospheres differentiated for 7 days in the presence of 1 μm 7-Ni. Representative histograms compare expression levels of neural markers in untreated neurospheres (gray) and treated with 7-Ni (green). G, regulation of AS, eNOS and nNOS expression in differentiated neurospheres (day 7) in the presence of activators and inhibitors of the NO-citrulline cycle. H, Western blot analysis was performed to confirm increased eNOS expression in l-NAME-treated neurospheres. The data shown are representative for at least two independent experiments. The data are presented as the mean values ± S.E. ***, p < 0.001. β-tub, β-tubulin, l-cit, l-citrulline.
FIGURE 5.
FIGURE 5.
Differential BDNF expression during neurosphere differentiation. For real time PCR experiments, neurospheres were cultured in the absence or presence of 1 mm of l-NAME, 1 mm MDLA, 1 mm l-arginine, or 1 mm l-citrulline and collected on different days of differentiation on day 7 of differentiation. A, BDNF gene expression along neurospheres differentiation. B, BDNF expression changes in neurospheres treated during 7 days of differentiation with inhibitors or substrates of NO-citrulline cycle enzymes. The obtained data are shown as the mean values ± S.E. of three independent experiments. ***, p < 0.001. l-arg, l-arginine; l-cit, l-citrulline.
FIGURE 6.
FIGURE 6.
BDNF-mediated reversion of neurosphere differentiation caused by inhibitors of NO-citrulline cycle. A, immunostaining of neurospheres differentiated in the presence of 1 mm l-NAME, 1 mm MDLA, 20 ng/ml BDNF, 20 ng/ml BDNF and 1 mm l-NAME, or 20 ng/ml BDNF and 1 mm MDLA, for β3-tubulin (β-tub) and GFAP expression. Scale bar, 20 μm. The data were analyzed using the NIS Elements software (Nikon) and represented as the ratio of β3-tubulin or GFAP fluorescence intensity over DAPI fluorescence intensity. B, analysis of gene expression of specific markers for mature neurons (MAP-2), glia (GFAP), differentiating neurons (β3-tubulin, beta 3), and progenitor cells (Nestin) on day 7 of neurosphere differentiation by real time PCR. The data are shown as the mean values ± S.E. of three independent experiments. *, p < 0.05; **, p < 0.01; ***, p < 0.001, compared with control experiments obtained with cells differentiated without any of these compounds.
FIGURE 7.
FIGURE 7.
Effects of inhibition of NO production and of BDNF on neural progenitor cell proliferation. A, immunodetection of BrdU incorporation following a 12-h pulse in differentiating neurospheres on day 7 in the presence of 1 mm l-NAME, 1 mm MDLA, 20 ng/ml BDNF, 20 ng/ml BDNF and 1 mm MDLA, or 20 ng/ml BDNF and 1 mm l-NAME. BrdU incorporating nuclei are shown in green. Scale bar, 20 μm. B, quantification of proliferation in different conditions of treatment was performed by determining the ratio of BrdU+ over DAPI+ cells. Six fields were analyzed for each treatment by using the NIS Elements software (Nikon). *, p < 0.05, compared with untreated control cells). CTR, control.
FIGURE 8.
FIGURE 8.
Interference of inhibited NO production with neural stem cell migration. Neurospheres were differentiated for 7 days in the presence or absence of 1 mm l-NAME or 1 mm l-NAME and 20 ng/ml BDNF. The cells were visualized by cell nuclei staining, and the distances of migration were determined by using the NIS Elements software (Nikon).
FIGURE 9.
FIGURE 9.
Modulation of p75 neurotrophin receptor expression in neurospheres. The cells were culture in the presence of 1 mm MDLA, 1 mm l-NAME, 20 ng/ml BDNF, or 1 μm 7-Ni. A, neurospheres were collected on day 7 of differentiation for RNA extraction, and p75NTR expression was analyzed by real time PCR. B, flow cytometry analysis of p75NTR expression in murine neurospheres differentiated for 7 days in the absence or presence of the nNOS inhibitor. The data are shown as mean values ± S.E. of three independent experiments. **, p < 0.01; ***, p < 0.001, compared with untreated control cells.
FIGURE 10.
FIGURE 10.
BDNF restores neural differentiation inhibited by lack of nitric oxide. NO signaling is essential for the spontaneous progress of neural fate determination. After plating, neural stem cells spontaneously differentiate into neurons, astrocytes, and oligodendrocytes. However, when formation of endogenous NO is interrupted by inhibitors of the NO-citrulline cycle (l-NAME, 7-Ni, and MDLA inhibiting all isoforms of NOS, AS, and nNOS, respectively), the progress of neural differentiation is blocked. In these conditions, NSC remain in a proliferative state; they do not migrate, nor do they differentiate into neural cells. BDNF does not affect neural differentiation in the absence of the above-cited inhibitors, but it re-establishes migration and differentiation of NSC when the NO-citrulline cycle is blocked. The addition of BDNF to NSC cultures treated with l-NAME, 7-Ni, or MDLA decreases proliferation and promotes migration and neural differentiation. These BDNF-induced effects are suggested to result from an increase in p75NTR expression induced by lack of NO. The p75NTR is required for BDNF-induced differentiation of neural stem cells, pointing at a novel mechanism for joint actions between the NO-citrulline cycle and BDNF for the maintenance of normal neurodevelopment processes.

References

    1. Moroz L. L., Gillette R., Sweedler J. V. (1999) Single-cell analyses of nitrergic neurons in simple nervous systems. J. Exp. Biol. 202, 333–341 - PubMed
    1. Reynolds B. A., Weiss S. (1996) Clonal and population analyses demonstrate that an EGF-responsive mammalian embryonic CNS precursor is a stem cell. Dev. Biol. 175, 1–13 - PubMed
    1. McKay R. (1997) Stem cells in the central nervous system. Science 276, 66–71 - PubMed
    1. Gage F. H. (2000) Mammalian neural stem cells. Science 287, 1433–1438 - PubMed
    1. Trujillo C. A., Schwindt T. T., Martins A. H., Alves J. M., Mello L. E., Ulrich H. (2009) Novel perspectives of neural stem cell differentiation. From neurotransmitters to therapeutics. Cytometry A 75, 38–53 - PubMed

Publication types

MeSH terms