. 2012 Aug 17;287(34):28755-69.
doi: 10.1074/jbc.M112.345546. Epub 2012 Jun 22.

O-linked β-N-acetylglucosaminylation (O-GlcNAcylation) in primary and metastatic colorectal cancer clones and effect of N-acetyl-β-D-glucosaminidase silencing on cell phenotype and transcriptome

Affiliations

O-linked β-N-acetylglucosaminylation (O-GlcNAcylation) in primary and metastatic colorectal cancer clones and effect of N-acetyl-β-D-glucosaminidase silencing on cell phenotype and transcriptome

Galit Yehezkel et al. J Biol Chem. .

Abstract

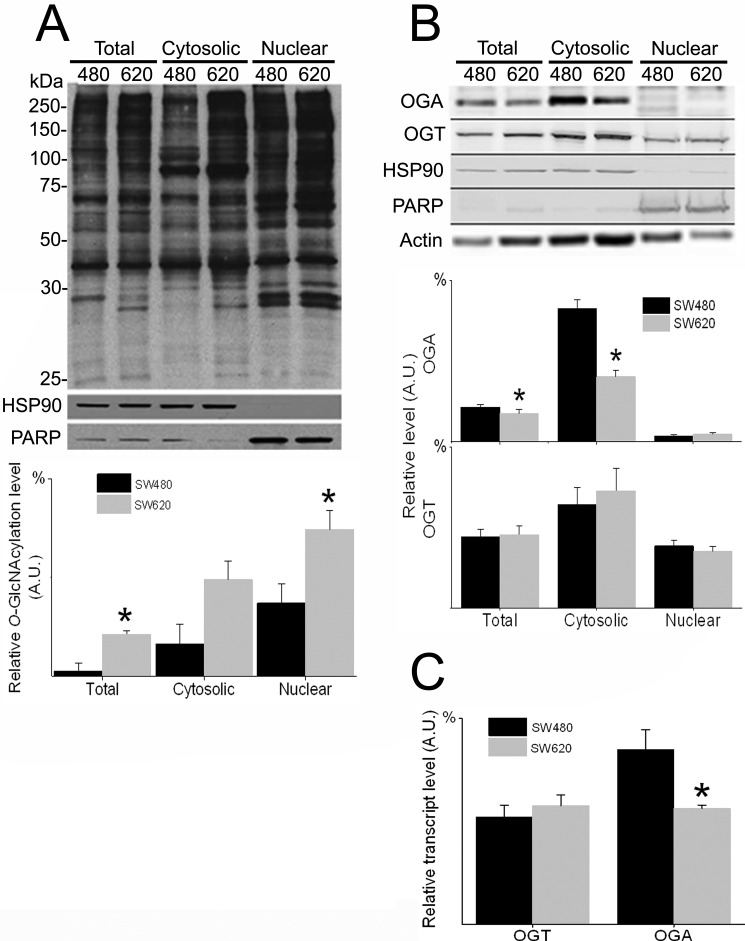
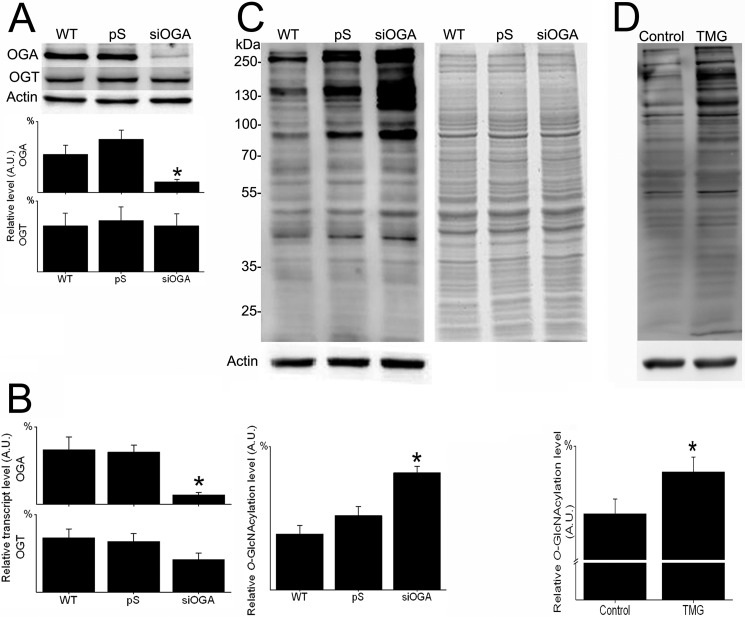
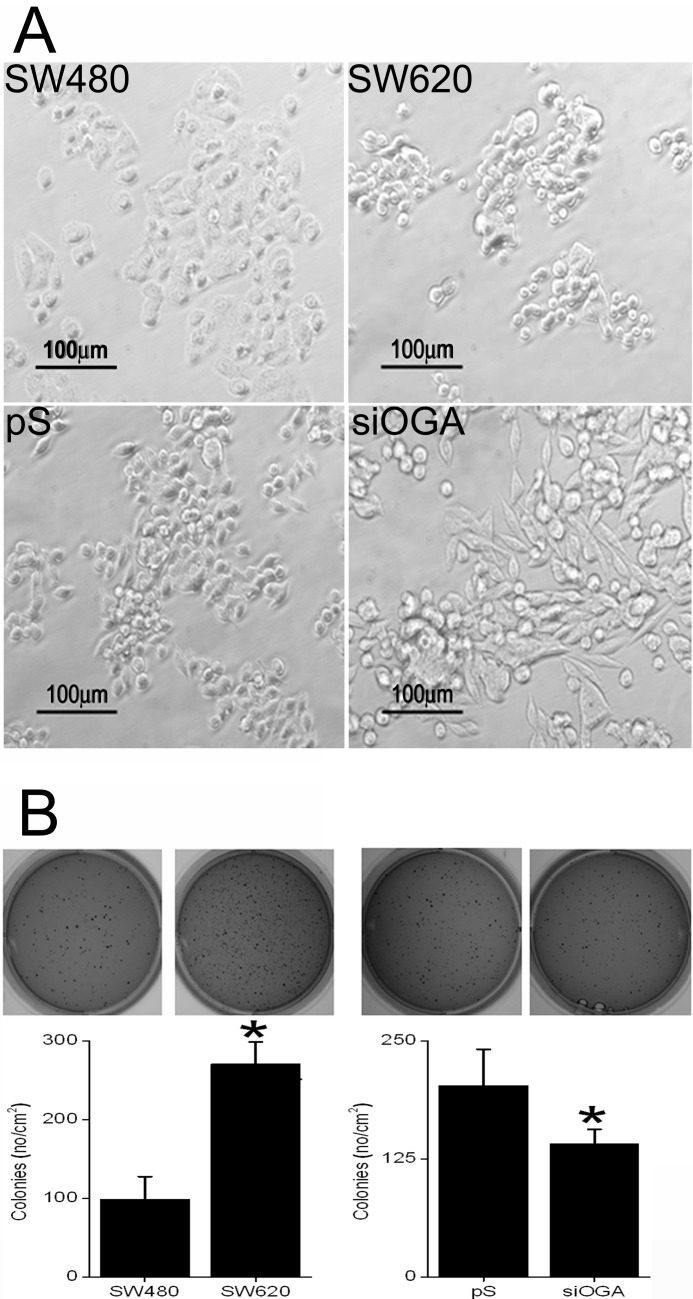
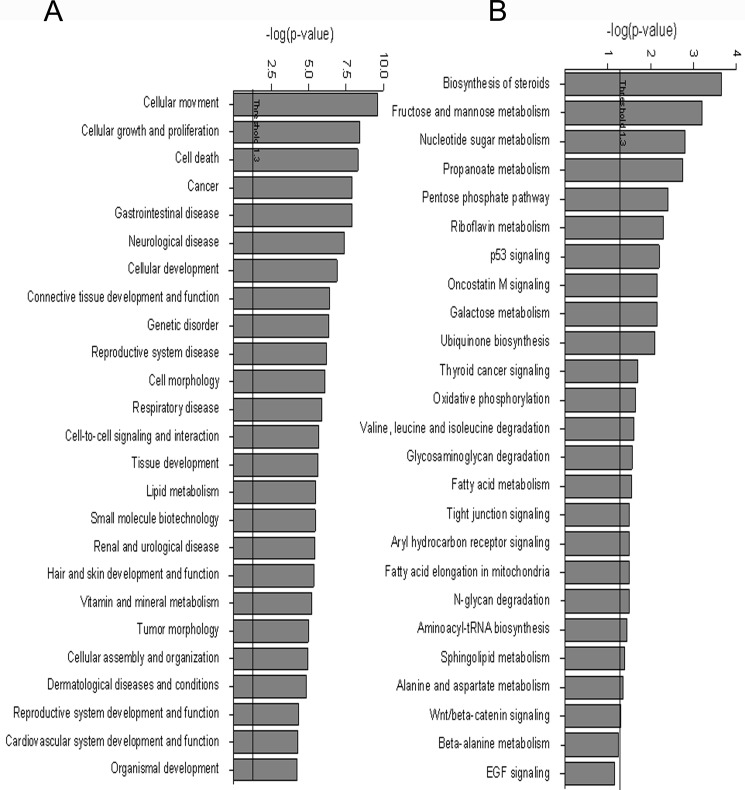
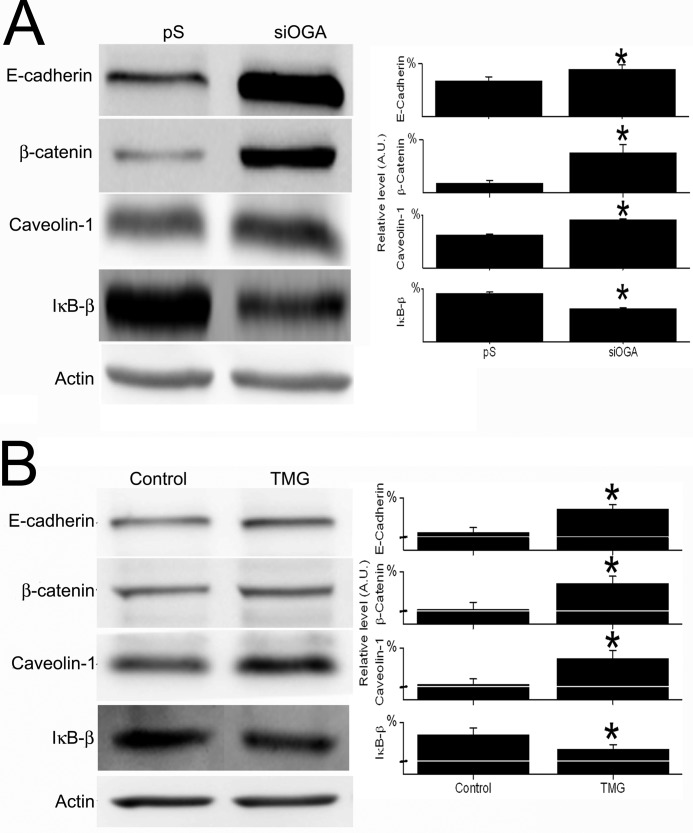
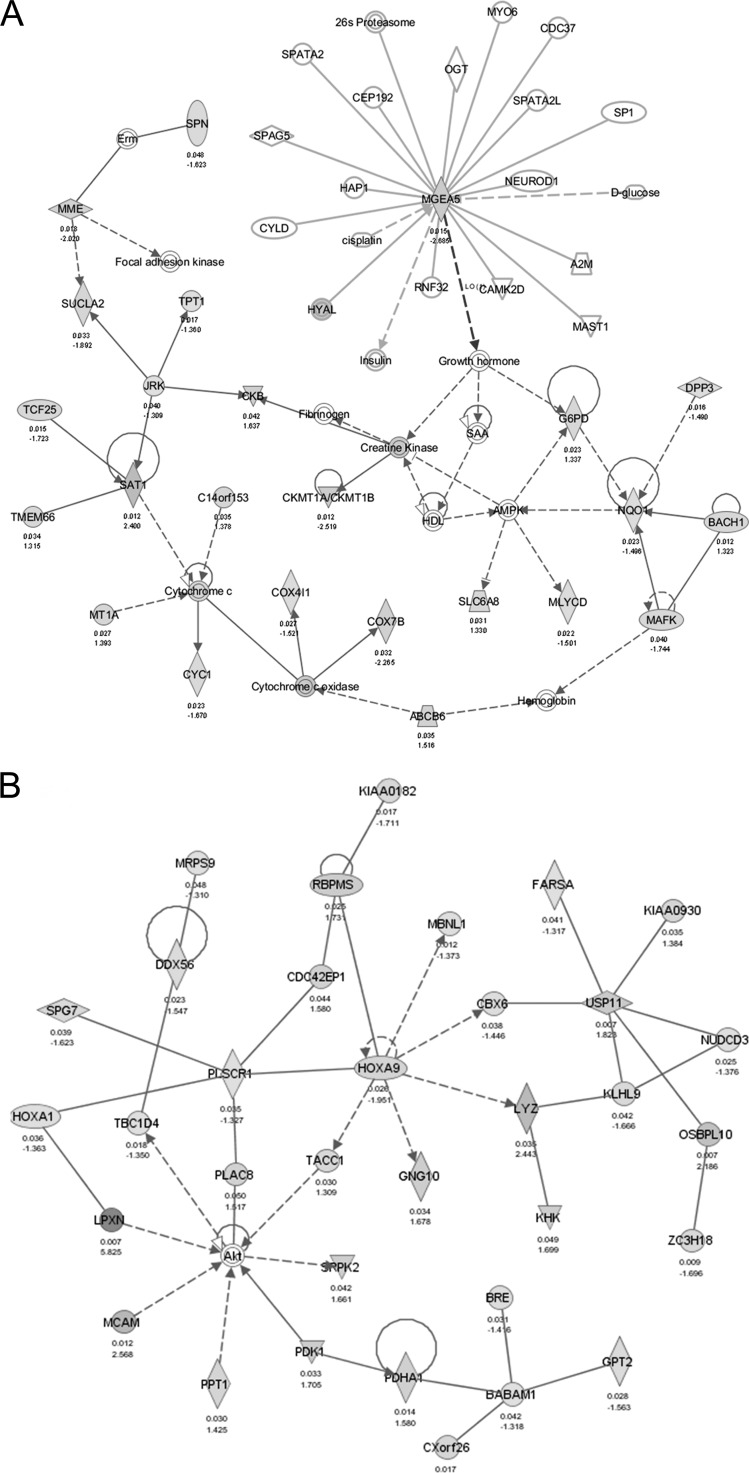
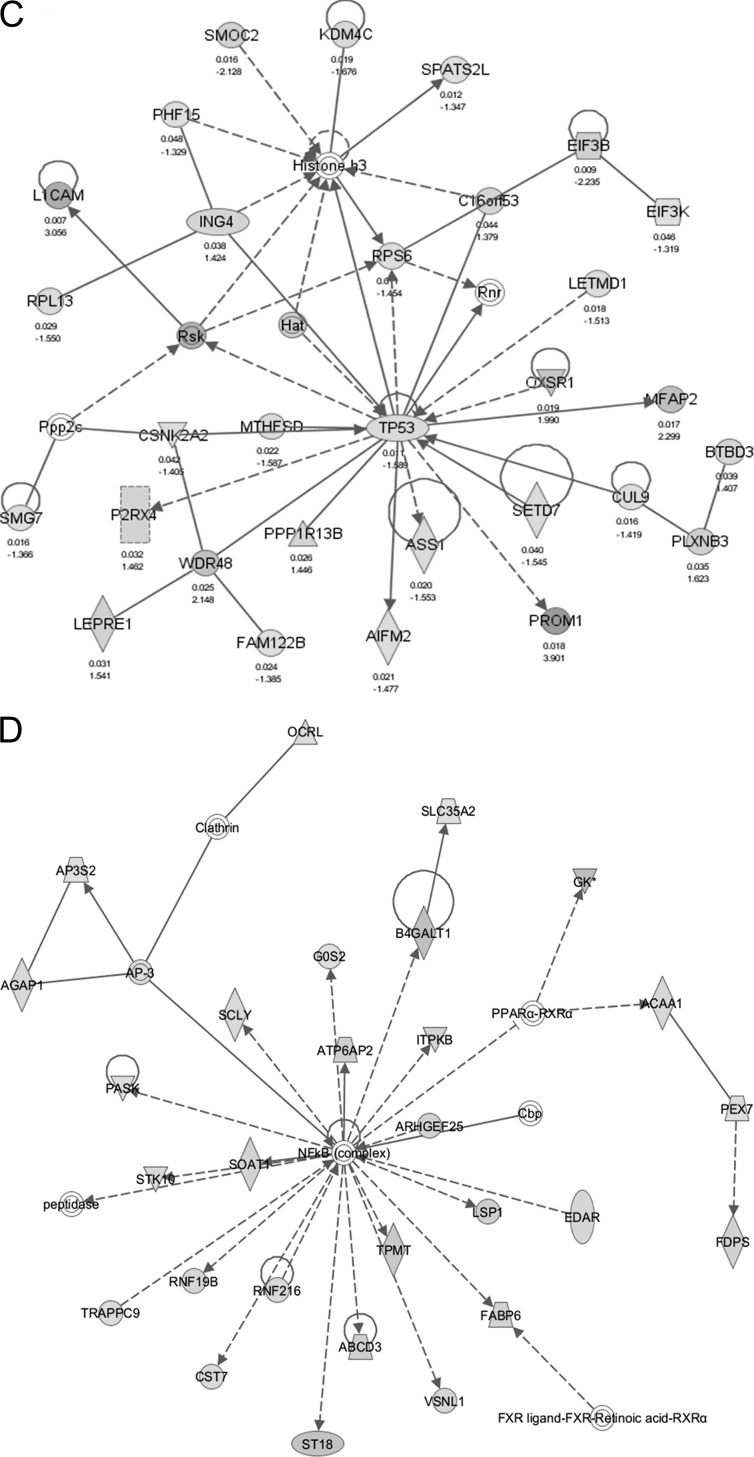
O-linked β-N-acetylglucosamine (O-GlcNAc) glycosylation is a regulatory post-translational modification occurring on the serine or threonine residues of nucleocytoplasmic proteins. O-GlcNAcylation is dynamically regulated by O-GlcNAc transferase and O-GlcNAcase (OGA), which are responsible for O-GlcNAc addition and removal, respectively. Although O-GlcNAcylation was found to play a significant role in several pathologies such as type II diabetes and neurodegenerative diseases, the role of O-GlcNAcylation in the etiology and progression of cancer remains vague. Here, we followed O-GlcNAcylation and its catalytic machinery in metastatic clones of human colorectal cancer and the effect of OGA knockdown on cellular phenotype and on the transcriptome. The colorectal cancer SW620 metastatic clone exhibited increased O-GlcNAcylation and decreased OGA expression compared with its primary clone, SW480. O-GlcNAcylation elevation in SW620 cells, through RNA interference of OGA, resulted in phenotypic alterations that included acquisition of a fibroblast-like morphology, which coincides with epithelial metastatic progression and growth retardation. Microarray analysis revealed that OGA silencing altered the expression of about 1300 genes, mostly involved in cell movement and growth, and specifically affected metabolic pathways of lipids and carbohydrates. These findings support the involvement of O-GlcNAcylation in various aspects of tumor cell physiology and suggest that this modification may serve as a link between metabolic changes and cancer.


Figures

FIGURE 1.
FIGURE 1.
O-GlcNAcylation is elevated and OGA is down-regulated in metastatic CRC clone compared with primary clone. Total, cytosolic, and nuclear proteins were purified from primary SW480 and metastatic SW620 cells and analyzed for levels of O-GlcNAcylation, OGA, and OGT. A, upper panel, representative Western blots using anti-O-GlcNAc (CTD110.6), HSP90, and PARP antibodies. HSP90 and PARP were used as cytosolic and nuclear fraction markers, respectively. Lower panel, quantitative analysis of the relative O-GlcNAcylation levels in the various fractions of the two CRC clones. B, upper panel, representative Western blots using anti-OGA, OGT, HSP90, PARP, and actin antibodies. Actin was used to evaluate protein quantity. Lower panel, quantitative analysis of relative OGA and OGT levels. C, relative OGA and OGT transcript levels in the CRC clones as quantified by real time RT-PCR. All quantitative results (A.U., arbitrary units) are expressed as the mean ± S.E. of at least three repeats. Asterisks indicate significant difference between clones (p ≤ 0.05).
FIGURE 2.
FIGURE 2.
OGA silencing and selective pharmacological inhibition elevate O-GlcNAcylation in CRC cells. Total proteins were extracted from SW620 cells (WT) and from SW620 carrying the pSUPER plasmid, with or without an OGA-silencing sequence (pS and siOGA, respectively), and analyzed for levels of OGA, OGT, and O-GlcNAcylation. A, upper panel, representative Western blots using anti-OGA, OGT, and actin antibodies. Lower panel, quantitative analysis of relative OGA and OGT levels in the various cell lines. B, relative OGA and OGT transcript levels in the various cell lines, as quantified by real time RT-PCR. C, upper panel, representative Western blots using anti-O-GlcNAc and anti-actin antibodies (left panel) and the corresponding Coomassie Blue-stained gel (right panel). Lower panel, quantitative analysis of the relative O-GlcNAcylation levels in the various cell lines. D, total proteins were extracted from SW620 cells (control) and from SW620 cells treated with 25 μm TMG for 24 h (TMG) and analyzed for the level of O-GlcNAcylation. Upper panel, representative Western blots using anti-O-GlcNAc (RL2) and anti-actin antibodies. Lower panel, quantitative analysis of the relative O-GlcNAcylation level in the two samples. All quantitative results (A.U., arbitrary units) are expressed as the mean ± S.E. of at least three repeats. Asterisks indicate significant difference between clones (p ≤ 0.05).
FIGURE 3.
FIGURE 3.
OGA silencing alters the morphology and reduces the anchorage-independent growth of CRC cells. A, representative images of the CRC clones morphology. Note spindle-shaped cells in siOGA. B, colony formation in soft agar of the CRC clones. For each cell line, triplicates of 104 cells were seeded, and 14 days later they were stained with crystal violet, counted, and photographed. Upper panel, representative images of colony-bearing agar dishes. Lower panel, quantification of colony formation. SW480, primary CRC clone; SW620, metastatic CRC clone; pS, SW620 subclone carrying an empty pSUPER plasmid; siOGA, SW620 subclone carrying an OGA silencing sequence. All quantitative results are expressed as the mean ± S.E. of at least six different repeats. Asterisks indicate significant difference between clones (p ≤ 0.01).
FIGURE 4.
FIGURE 4.
OGA silencing affects the transcriptome of SW620 metastatic CRC clone. Control pS-SW620 cells and OGA-silenced SW620 cells were subjected to cDNA microarray analysis. Gene Ontology-based over-representation for the microarray dataset was performed with the IPA software. Over-represented genes were categorized according to their functions (A), and canonical pathways were annotated using the KEGG database (B).
FIGURE 5.
FIGURE 5.
Experimental validation of microarray data for four selected proteins. Total proteins were extracted from pS-SW620 and siOGA-SW620 cells and analyzed for the levels of four proteins that showed altered regulation by cDNA microarray assay. A, left panel, representative Western blots using anti-E-cadherin, β-catenin, caveolin-1, IκB-β, and actin antibodies. Right panel, quantitative analysis of the protein levels in the two cell lines. B, total proteins were extracted from SW620 cells (control) and from SW620 cells treated with 25 μm TMG for 24 h (TMG) and analyzed for the level of the above-mentioned proteins. Left panel, representative Western blots. Right panel, quantitative analysis of the relative protein levels in the two samples. All quantitative results (A.U., arbitrary units) are expressed as the mean ± S.E. of at least three repeats. Asterisks indicate significant difference between clones (p ≤ 0.05).
FIGURE 6.
FIGURE 6.
IPA of genes correlated with OGA silencing. Red and green (online) indicate up- and down-regulated genes, respectively, following OGA silencing. Solid and broken lines indicate direct and indirect interactions, respectively, between molecules. A, network centered around MGEA5, the OGA gene, indicating its up- and downstream interactions. B, top network number 1 (see Table 1), focusing on lipid metabolism, post-translation modifications, and small molecule biochemistry. C, top network number 5, focusing on cancer, protein synthesis, cellular function, and maintenance. D, top network number 7, focusing on carbohydrate metabolism, molecular transport, and nucleic acid metabolism.
FIGURE 6.
FIGURE 6.
IPA of genes correlated with OGA silencing. Red and green (online) indicate up- and down-regulated genes, respectively, following OGA silencing. Solid and broken lines indicate direct and indirect interactions, respectively, between molecules. A, network centered around MGEA5, the OGA gene, indicating its up- and downstream interactions. B, top network number 1 (see Table 1), focusing on lipid metabolism, post-translation modifications, and small molecule biochemistry. C, top network number 5, focusing on cancer, protein synthesis, cellular function, and maintenance. D, top network number 7, focusing on carbohydrate metabolism, molecular transport, and nucleic acid metabolism.

References

    1. Zeidan Q., Hart G. W. (2010) The intersections between O-GlcNAcylation and phosphorylation. Implications for multiple signaling pathways. J. Cell Sci. 123, 13–22 - PMC - PubMed
    1. Zachara N. E., Hart G. W. (2002) The emerging significance of O-GlcNAc in cellular regulation. Chem. Rev. 102, 431–438 - PubMed
    1. Butkinaree C., Park K., Hart G. W. (2010) O-Linked β-N-acetylglucosamine (O-GlcNAc). Extensive cross-talk with phosphorylation to regulate signaling and transcription in response to nutrients and stress. Biochim. Biophys. Acta 1800, 96–106 - PMC - PubMed
    1. Zachara N. E., O'Donnell N., Cheung W. D., Mercer J. J., Marth J. D., Hart G. W. (2004) Dynamic O-GlcNAc modification of nucleocytoplasmic proteins in response to stress. A survival response of mammalian cells. J. Biol. Chem. 279, 30133–30142 - PubMed
    1. Hart G. W. (1997) Dynamic O-linked glycosylation of nuclear and cytoskeletal proteins. Annu. Rev. Biochem. 66, 315–335 - PubMed

Publication types

LinkOut - more resources