Randomized Controlled Trial
. 2012 Nov;48(11):1136-45.
doi: 10.1016/j.oraloncology.2012.05.015. Epub 2012 Jun 23.

Serum biomarker modulation following molecular targeting of epidermal growth factor and cyclooxygenase pathways: a pilot randomized trial in head and neck cancer

Affiliations
Randomized Controlled Trial

Serum biomarker modulation following molecular targeting of epidermal growth factor and cyclooxygenase pathways: a pilot randomized trial in head and neck cancer

Howard S Moskowitz et al. Oral Oncol. 2012 Nov.

Abstract

Objective: Targeting the epidermal growth factor receptor (EGFR) using the tyrosine kinase inhibitor (TKI) erlotinib has demonstrated activity in aerodigestive tract malignancies. Co-targeting of the G-protein-coupled receptor cyclooxygenase (COX) with EGFR inhibitors has shown promise in preclinical models and early phase clinical studies.

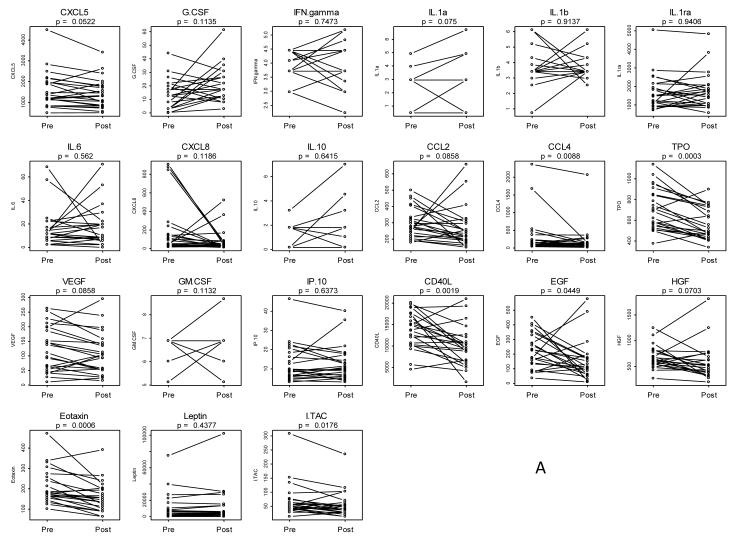
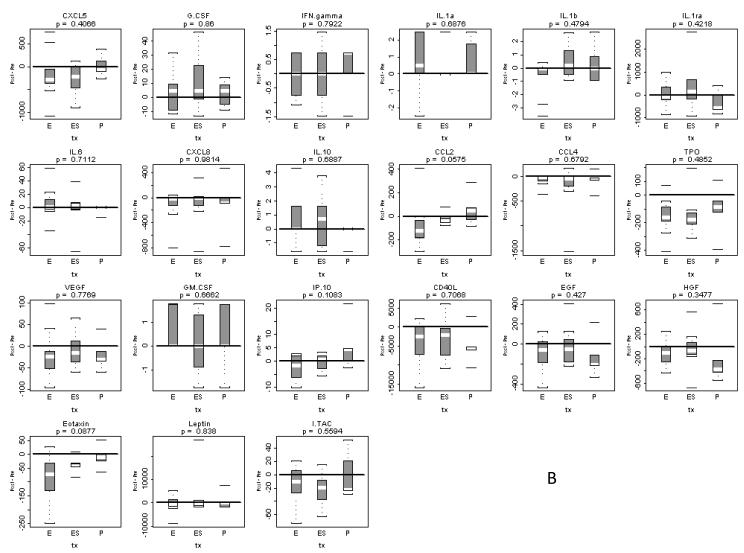
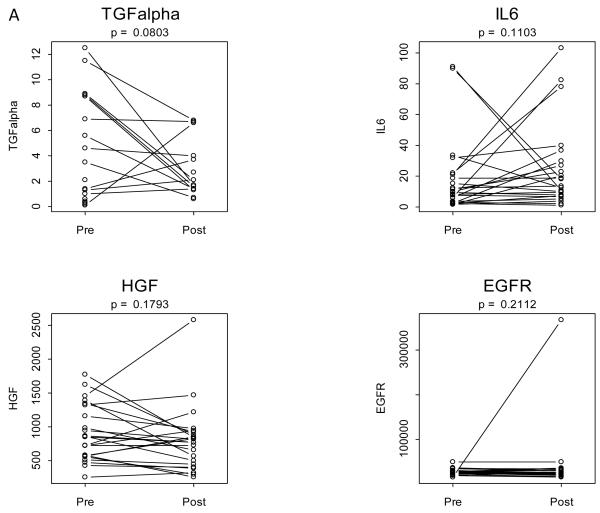
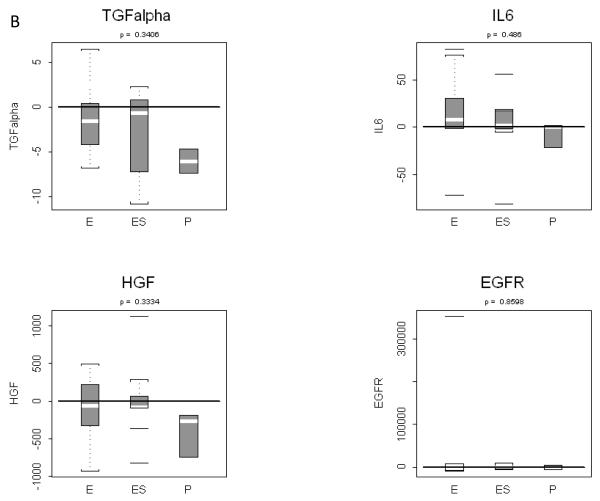
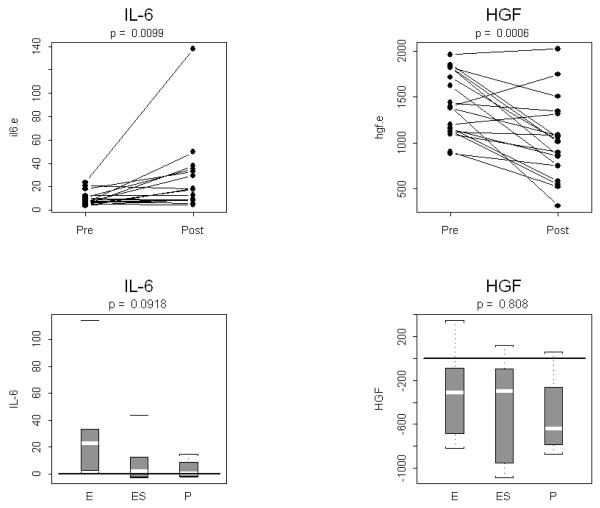
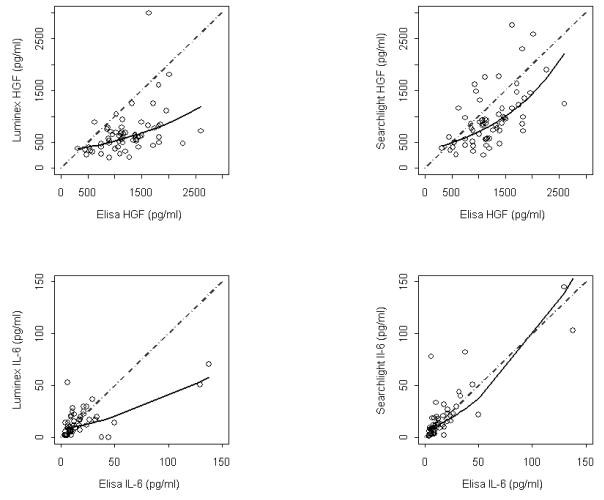
Materials and methods: We studied the modulation of serum proteins after neoadjuvant treatment with erlotinib with or without sulindac in head and neck cancer patients. In a prospective, randomized, double-blind clinical trial, paired serum samples were obtained before and after neoadjuvant treatment in three groups of patients (n = 23 total), who were randomized to receive 7-14 consecutive days of erlotinib alone, erlotinib plus sulindac, or placebo. Two separate multiplexed ELISA systems (SearchLight™ or Luminex™) were used to measure serum biomarkers. HGF and IL-6 levels were tested on both systems, and validated using single analyte ELISAs.

Results: Several analytes were significantly altered (generally decreased) post-treatment, in patients who received erlotinib (with or without sulindac) as well as in the placebo groups. No single analyte was differentially altered across the three treatment groups using either multiplex platform. Single HGF ELISA suggested a nonspecific decrease in all patients.

Conclusion: These results demonstrate the importance of a placebo group when assessing changes in expression of serum biomarkers. While multiplex platforms can provide quantitative information on a large number of serum analytes, results should be cautiously compared across platforms due to their intrinsic features. Furthermore, the dynamic range of expression of a single analyte is constrained in multiplex versus standard ELISA.


Figures

Figure 1
Figure 1. Pre to post changes in 23 serum analytes measured by Luminex™
(A) Individual patients are depicted with a straight line connecting pre treatment to post treatment. The unadjusted p-value resulting from a two-tailed signed rank test is provided above each graph. Five analytes were significantly changed after limiting false discovery to 10%: TPO, Eotaxin, CD40L, CCL4 and ITAC. (B) Box and whisker plots of patient differences shown by treatment group. The randomly assigned groups are shown on the X axis, E = erlotinib, ES = erlotinib + sulindac, P = placebo. The p-value for the two-tailed Kruskal-Wallis test of group equality is shown above each plot.
Figure 2
Figure 2. Pre to post changes in 4 serum analytes measured with the SeachLight platform
(A) Individual patients are depicted with a straight line connecting pre treatment to post treatment. The p-value resulting from a two-tailed signed rank test is provided above each graph. (B) Box and whisker plots of patient differences shown by treatment group. The randomly assigned groups are shown on the x asis, E = erlotinib, ES = erlotinib + sulindac, P = placebo. The p-value for the two-tailed Kruskal-Wallis test of group equality is shown above each plot.
Figure 3
Figure 3. Pre to post changes in 4 serum analytes measured with the ELISA assay
(A) Individual patients are depicted with a straight line connecting pre treatment to post treatment. The p-value resulting from a two-tailed signed rank test is provided above each graph. (B) Box and whisker plots of patient differences shown by treatment group. The randomly assigned groups are shown on the x-axis, E = erlotinib, ES = erlotinib + sulindac, P = placebo. The p-value for the two-tailed Kruskal-Wallis test of group equality is shown above each plot.
Figure 4
Figure 4. Concordance of assay platforms
Sixty-six patient serum samples of two analytes IL-6 and HGF were measured by ELISA, Luminex and Searchlight. ELISA was regarded as the reference standard and plotted on the X axis of all plots. A linear regression model was fit for each pair with Luminex (left column) or Searchlight (right column) serving as the dependent variable. Based on examination of residuals either log or square root transformations were required for selection of correct models. The solid lines are predicted values from the best fitting regression models. A dashed diagonal reference has been added to show hypothetical perfect agreement. When compared to ELISA, the Luminex assay has a restricted linear range and consistently underestimates analyte expression.

References

    1. Argiris A, Karamouzis MV, Raben D, Ferris RL. Head and neck cancer. Lancet. 2008;371(9625):1695–709. - PMC - PubMed
    1. Moyer JD, Barbacci EG, Iwata KK, Arnold L, Boman B, Cunningham A, et al. Induction of apoptosis and cell cycle arrest by CP-358,774, an inhibitor of epidermal growth factor receptor tyrosine kinase. Cancer Res. 1997;57(21):4838–48. - PubMed
    1. Perez-Soler R, Chachoua A, Hammond LA, Rowinsky EK, Huberman M, Karp D, et al. Determinants of tumor response and survival with erlotinib in patients with non--small-cell lung cancer. J Clin Oncol. 2004;22(16):3238–47. - PubMed
    1. Gordon AN, Finkler N, Edwards RP, Garcia AA, Crozier M, Irwin DH, et al. Efficacy and safety of erlotinib HCl, an epidermal growth factor receptor (HER1/EGFR) tyrosine kinase inhibitor, in patients with advanced ovarian carcinoma: results from a phase II multicenter study. Int J Gynecol Cancer. 2005;15(5):785–92. - PubMed
    1. Soulieres D, Senzer NN, Vokes EE, Hidalgo M, Agarwala SS, Siu U. Multicenter phase II study of erlotinib, an oral epidermal growth factor receptor tyrosine kinase inhibitor, in patients with recurrent or metastatic squamous cell cancer of the head and neck. J Clin Oncol. 2004;22(1):77–85. - PubMed

Publication types

MeSH terms