. 2012 Oct;143(4):1006-16.e4.
doi: 10.1053/j.gastro.2012.06.034. Epub 2012 Jun 23.

Gut microbial products regulate murine gastrointestinal motility via Toll-like receptor 4 signaling

Affiliations

Gut microbial products regulate murine gastrointestinal motility via Toll-like receptor 4 signaling

Mallappa Anitha et al. Gastroenterology. 2012 Oct.

Abstract

Background & aims: Altered gastrointestinal motility is associated with significant morbidity and health care costs. Toll-like receptors (TLR) regulate intestinal homeostasis. We examined the roles of TLR4 signaling in survival of enteric neurons and gastrointestinal motility.

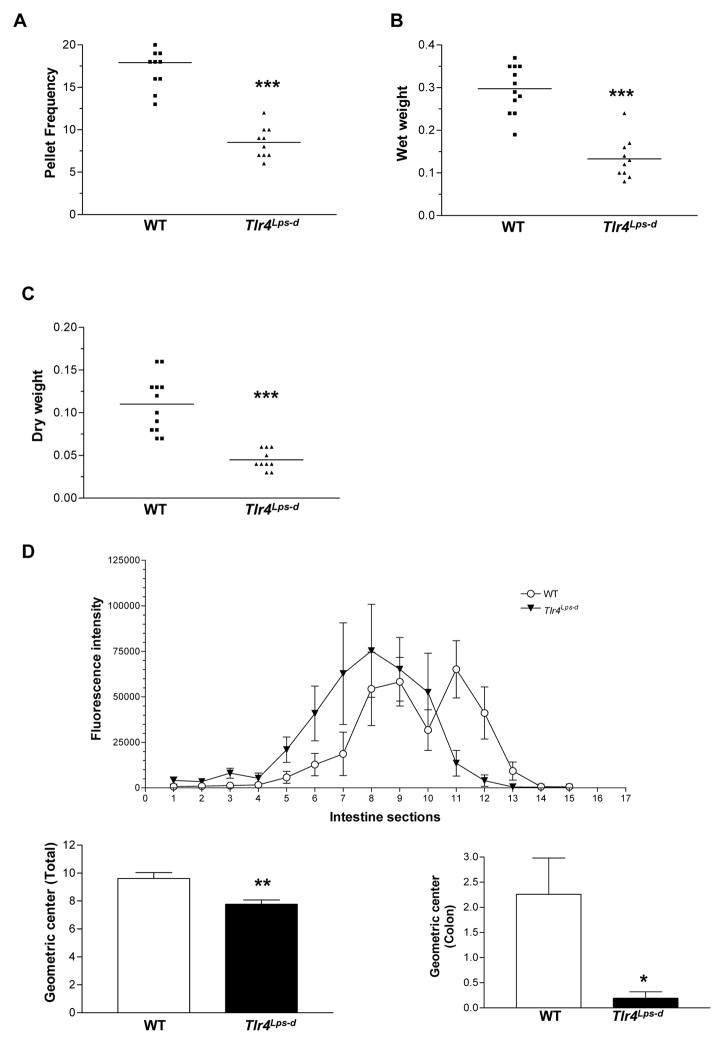
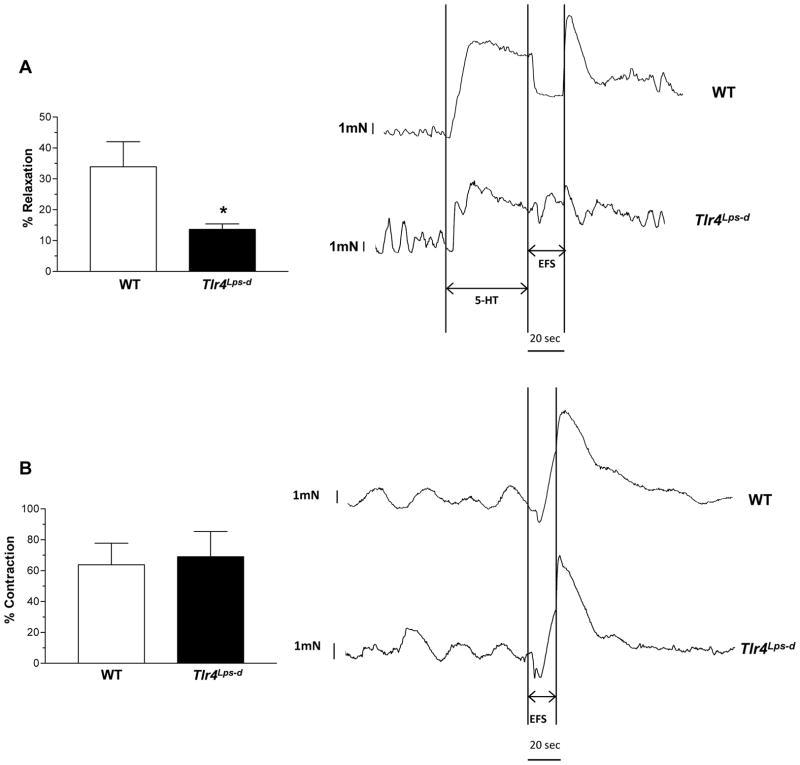
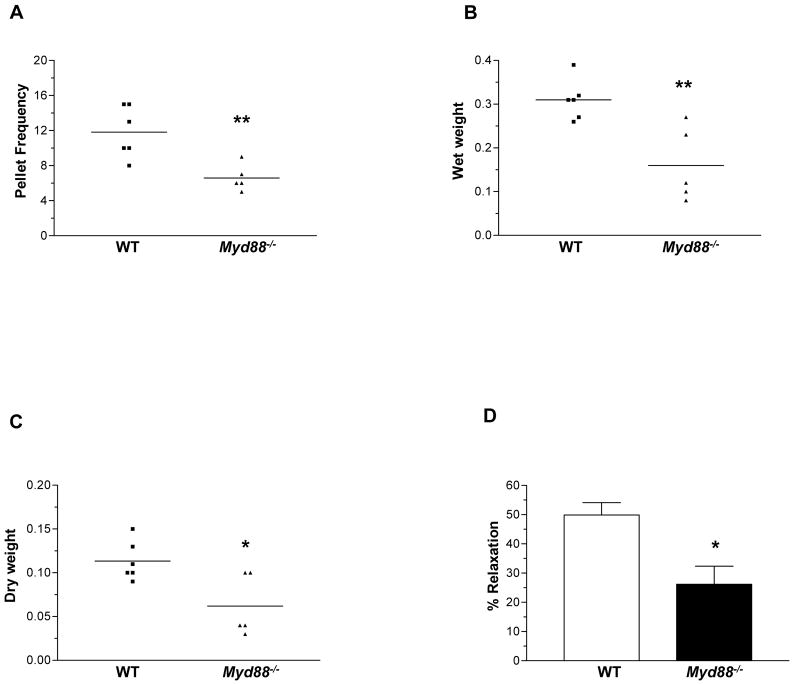
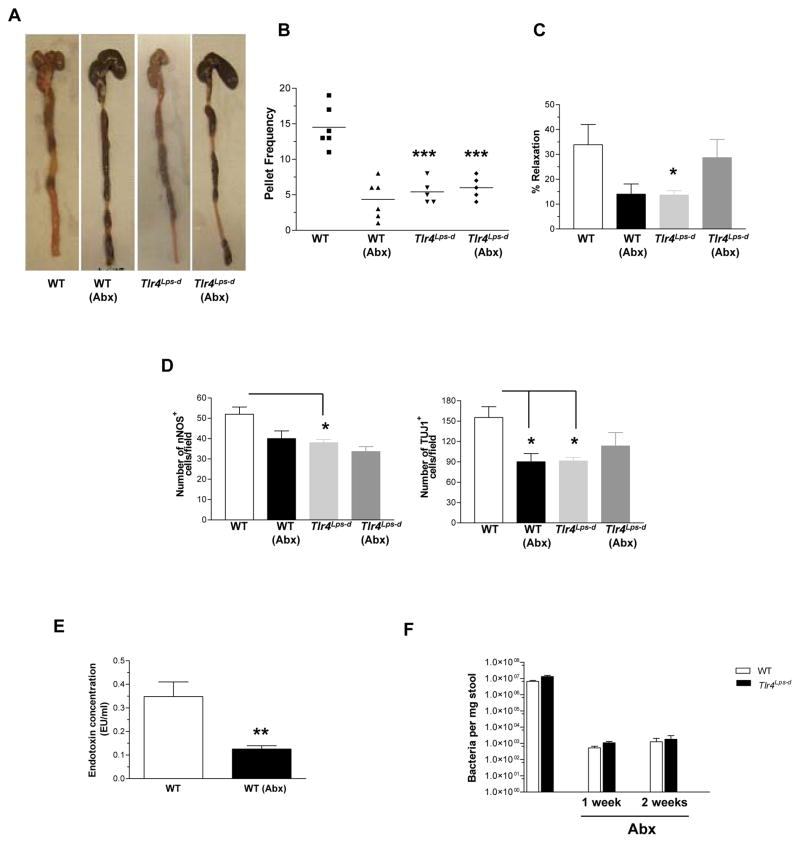
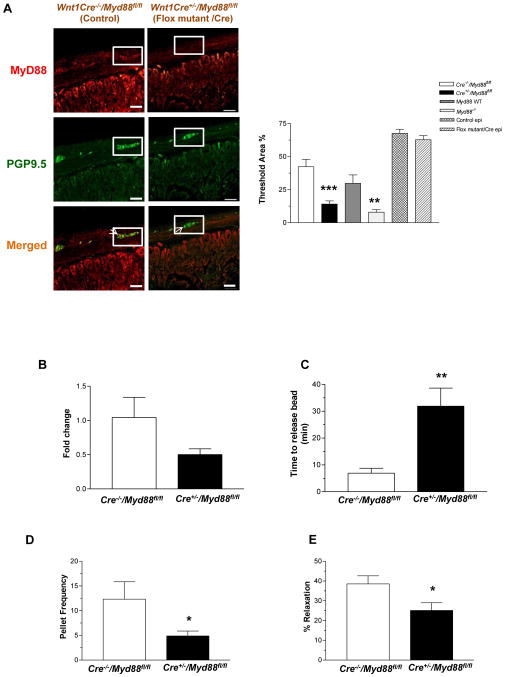
Methods: We assessed changes in intestinal motility by assessing stool frequency, bead expulsion, and isometric muscle recordings of colonic longitudinal muscle strips from mice that do not express TLR4 (Tlr4(Lps-d) or TLR4(-/-)) or Myd88 (Myd88(-/-)), in wild-type germ-free mice or wild-type mice depleted of the microbiota, and in mice with neural crest-specific deletion of Myd88 (Wnt1Cre(+/-)/Myd88(fl/fl)). We studied the effects of the TLR4 agonist lipopolysaccharide (LPS) on survival of cultured, immortalized fetal enteric neurons and enteric neuronal cells isolated from wild-type and Tlr4(Lps-d) mice at embryonic day 13.5.

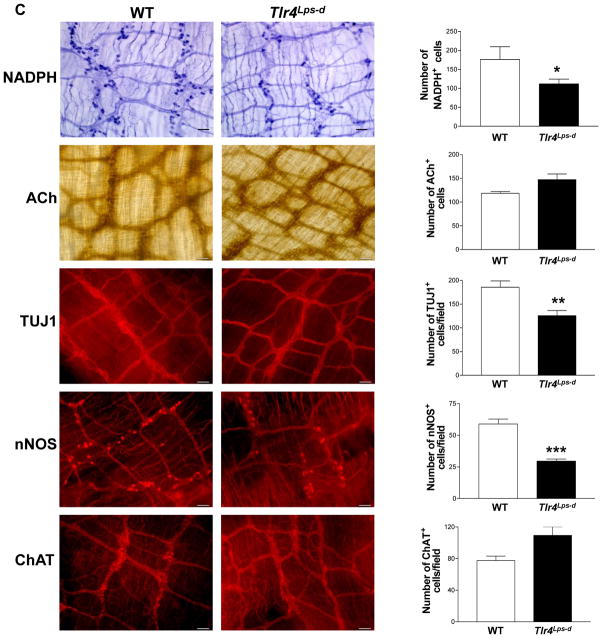
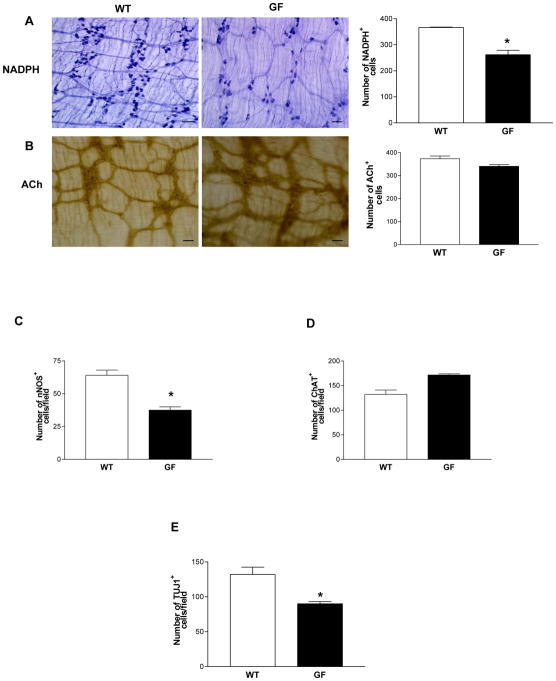
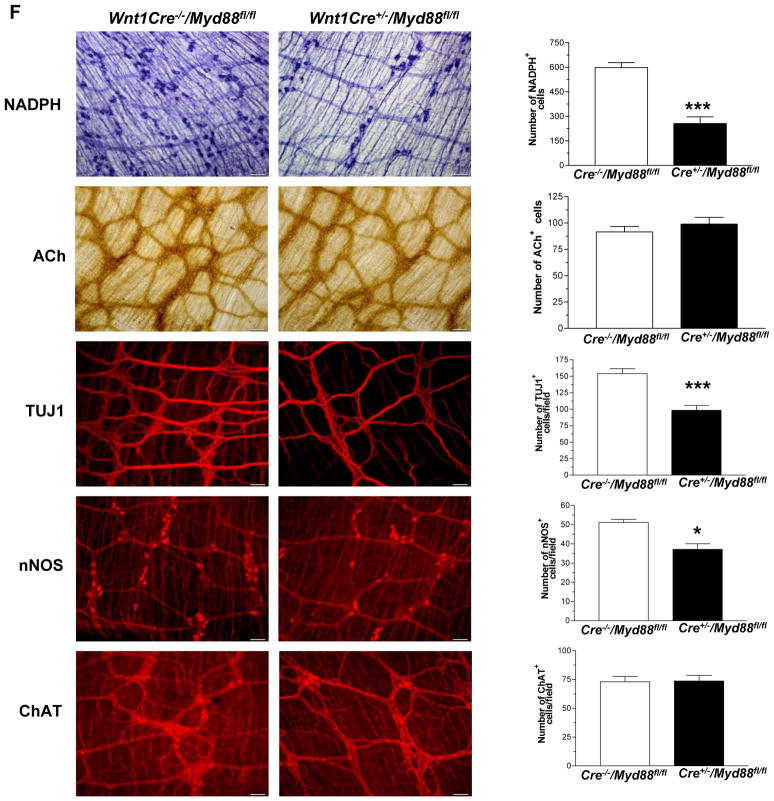
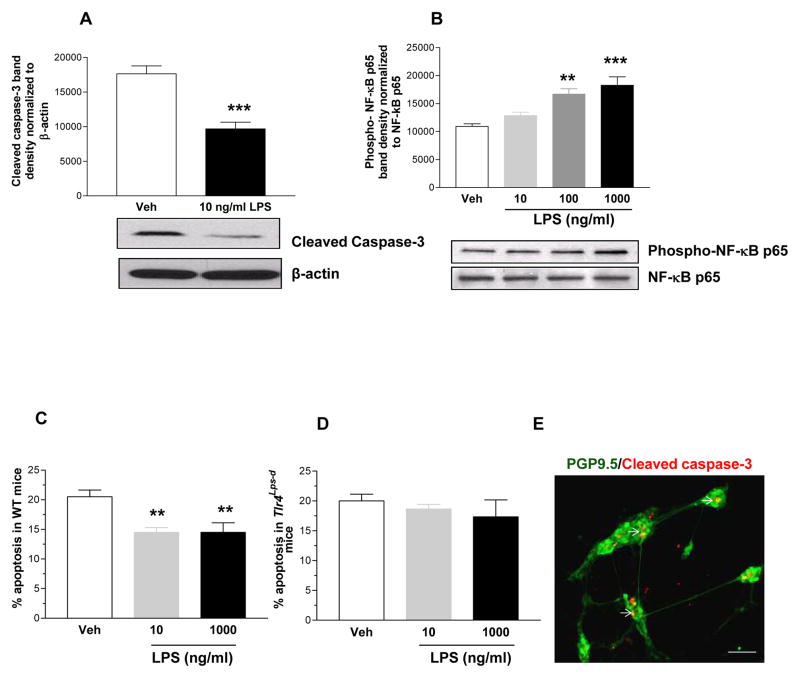
Results: There was a significant delay in gastrointestinal motility and reduced numbers of nitrergic neurons in TLR4(Lps-d), TLR4(-/-), and Myd88(-/-) mice compared with wild-type mice. A similar phenotype was observed in germ-free mice, mice depleted of intestinal microbiota, and Wnt1Cre(+/-)/Myd88(fl/fl) mice. Incubation of enteric neuronal cells with LPS led to activation of the transcription factor nuclear factor (NF)-κB and increased cell survival.

Conclusions: Interactions between enteric neurons and microbes increases neuron survival and gastrointestinal motility in mice. LPS activation of TLR4 and NF-κB appears to promote survival of enteric neurons. Factors that regulate TLR4 signaling in neurons might be developed to alter gastrointestinal motility.


Figures

Figure 1
Figure 1. Delayed intestinal transit in Tlr4Lps-d mice
(A–C) Stool characteristics studied to assess rate of intestinal motility include stool frequency, wet weight and dry weight. (D) Distribution of FITC in the segments of the small intestine (1–10), cecum (11), and colon (12–15), n=10. Results are mean ± SE. *P < 0.05, **P < 0.01, ***P < 0.001.
Figure 2
Figure 2. Reduced nitrergic responses in Tlr4Lps-d mice
(A) Tlr4Lps-d mice exhibit decreased colonic nitrergic relaxation in response to nerve stimulation compared to WT mice. (B) No difference in contractile responses was seen between WT and Tlr4Lps-d mice. Representative tracings are shown next to the histograms. The y axis represents force (mN); x axis represents time. Arrows indicate time points at which electrical field stimulus (EFS) was switched on and off. Results are expressed as percentage relaxation or contraction with respect to basal tone. (C) Representative photographs and histograms for proximal colon whole mount staining for NADPH Diaphorase, Acetylcholinesterase, and distal ileum whole mount staining for TUJ1, nNOS and ChAT are shown. The number of neurons stained for a specific marker was determined per unit area. Scale bar: 50 μm. Results are mean ± SE. n=6. *P < 0.05, **P < 0.01, ***P < 0.001.
Figure 3
Figure 3. Myd88−/− mice have delayed colonic transit and reduced nitrergic neurons
(A–C) Stool characteristics studied to assess rate of intestinal motility include stool frequency, wet weight and dry weight. (D) Myd88−/− mice exhibit decreased nitrergic relaxation in response to Electrical Field stimulation. Results are mean ± SE. n=5 or 6. *P < 0.05, **P < 0.01.
Figure 4
Figure 4. Germ free mice have reduced colonic nitrergic neurons
(A and B) Proximal colonic whole mount preparations stained for NADPH diaphorase and Acetylcholinesterase. (C–E) Distal ileum immunohistochemistry for the expression of nNOS, ChAT and TUJ1. The number of neurons stained for a specific marker was determined per unit area. At least 10 random fields were scored in a blinded fashion. Scale bar: 50 μm. Results are mean ± SE. n=6. *P < 0.05.
Figure 5
Figure 5. Alteration of intestinal microbiota results in delayed colonic motility
WT and Tlr4Lps-d mice treated with water or antibiotics (ampicillin and neomycin) for twelve weeks were studied to assess rate of gastrointestinal motility. Parameters measured include (A) Stool retention, (B) Pellet number, and (C) Nitrergic relaxation in response to EFS. (D) Whole mount staining data for nNOS and TUJ1 positive neurons. (E) Endotoxin measurement in WT mice in the presence or absence of antibiotic treatment. (F) Total bacterial content in the stool of mice treated with or without antibiotics. Values are mean ± SE. n = 5 or 6. *P < 0.05; **P < 0.01; ***P < 0.001.
Figure 6
Figure 6. Wnt1Cre+/−/Myd88fl/fl mice have delayed colonic transit and reduced nitrergic neurons
(A) Wnt1Cre−/−/Myd88fl/fl and Wnt1Cre+/−/Myd88fl/fl mice, and Myd88−/− mice were stained for Myd88 and neuronal marker PGP9.5. Histogram shows percentage of area stained for Myd88 in enteric ganglion or epithelial cells determined by morphometry. (B) Expression of Myd88, by real time-PCR in the enteric ganglia of Wnt1Cre+/−/Myd88fl/fl mice relative to Wnt1Cre−/−/Myd88fl/fl mice. (C) Colonic motility was determined by time to release bead as described in Methods section, and (D) Pellet frequency per hour was assessed in Wnt1Cre−/−/Myd88fl/fl and Wnt1Cre+/−/Myd88fl/fl. (E) Nitrergic relaxation in response to nerve stimulation was assessed in proximal colon of the mice. (F) Representative photographs and histograms of proximal colonic whole mount staining for NADPH Diaphorase, Acetylcholinesterase and terminal ileum whole mount staining for TUJ1, nNOS and ChAT. The number of neurons stained for a specific marker was determined per unit area. Scale bar: 50 μm. Results are mean ± SE. n=6. *P < 0.05, **P < 0.01, ***P < 0.001.
Figure 7
Figure 7. LPS stimulates NF-κB activation and enteric neuronal survival
(A) Western blot analysis for cleaved caspase-3 (17 KDa band) in neuronal cells treated with or without LPS (10 ng/ml), and (B) Phospho-NF-κB p65 in neuronal cells treated with or without LPS (10–1000 ng/ml). (C–E) Immunostaining of primary culture cells isolated from E13.5, WT and Tlr4Lps-d mice for cleaved caspase-3 costained with neuronal marker PGP9.5. A total of 200 neurons were assessed to determine the percentage of cleaved caspase-3 positive neurons. Arrows represent cleaved caspase-3 positive neurons. Scale bar: 50 μm. Results are mean ± SE. n=3. **P < 0.01, ***P < 0.001.

References

    1. Medzhitov R, Preston-Hurlburt P, Janeway CA., Jr A human homologue of the Drosophila Toll protein signals activation of adaptive immunity. Nature. 1997;388:394–7. - PubMed
    1. Rakoff-Nahoum S, Paglino J, Eslami-Varzaneh F, et al. Recognition of commensal microflora by toll-like receptors is required for intestinal homeostasis. Cell. 2004;118:229–41. - PubMed
    1. van Noort JM, Bsibsi M. Toll-like receptors in the CNS: implications for neurodegeneration and repair. Prog Brain Res. 2009;175:139–48. - PubMed
    1. Okun E, Griffioen KJ, Lathia JD, et al. Toll-like receptors in neurodegeneration. Brain Res Rev. 2009;59:278–92. - PMC - PubMed
    1. Barajon I, Serrao G, Arnaboldi F, et al. Toll-like Receptors 3, 4, and 7 Are Expressed in the Enteric Nervous System and Dorsal Root Ganglia. J Histochem Cytochem. 2009 - PMC - PubMed

Publication types

MeSH terms