. 2012 Sep;56(9):4753-9.
doi: 10.1128/AAC.00334-12. Epub 2012 Jun 25.

Role of ISKpn7 and deletions in blaKPC gene expression

Affiliations

Role of ISKpn7 and deletions in blaKPC gene expression

Thierry Naas et al. Antimicrob Agents Chemother. 2012 Sep.

Abstract

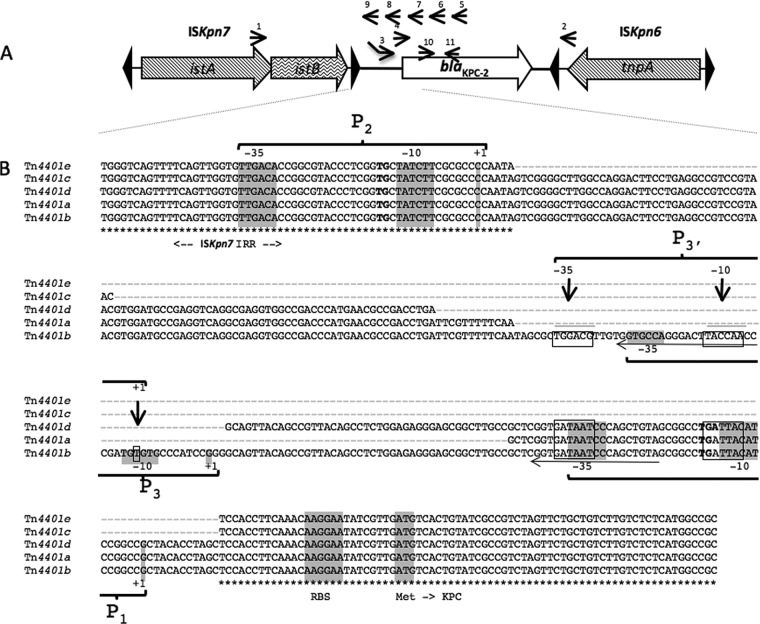
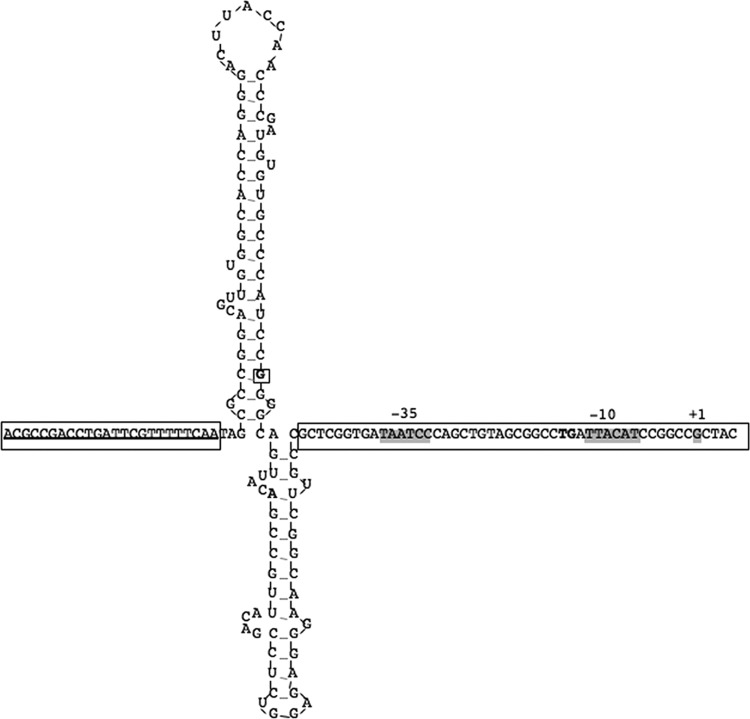
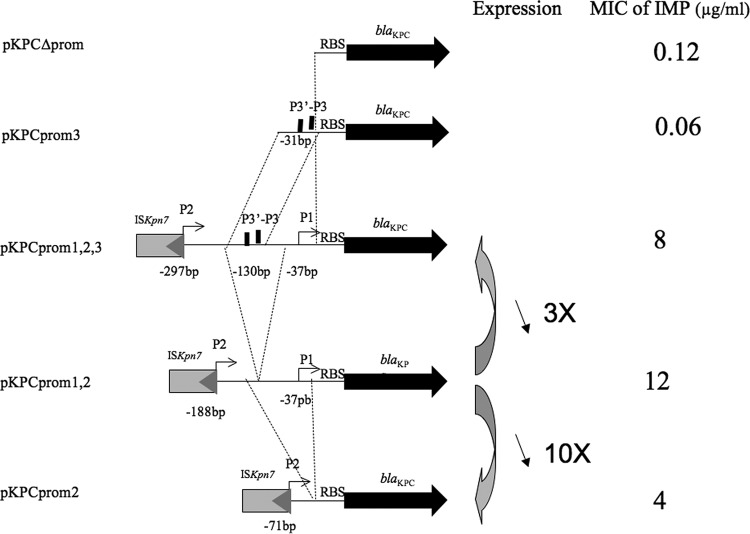
The carbapenemase-encoding bla(KPC) gene, which is rapidly spreading in Gram-negative rods, is located on a Tn3-based transposon, Tn4401, which carries a polymorphic region giving rise to five isoforms (a, b, c, d, and e) that is located immediately upstream of the bla(KPC) gene and thus likely involved in its expression. Using 5' rapid amplification of cDNA ends (5'RACE), we identified three potential promoter sequences (P1, P2, and P3) upstream of the bla(KPC) gene, of which only P1 (absent from isoforms c and d) and P2 (present in all isoforms, with a -35 box located inside the right inverted repeat of ISKpn7) were shown to be true promoters involved in expression. One representative of each different promoter combination of Tn4401, i.e., P2 alone (isoform c), P1-P2 (isoform a), and P1-P2-P3 (isoform b), was cloned into an Escherichia coli plasmid vector. Using reverse transcription-PCR (RT-PCR), the highest level of expression was obtained with isoform a (P1 and P2), which is also the most commonly encountered form in enterobacterial clinical isolates, followed by isoforms b (P1, P2, and P3) and c (P2 only). These differences in expression led to slight differences in MIC values of carbapenems. In silico analysis of the DNA sequence of isoform b revealed a stem-loop structure that is likely responsible for strong stops observed in 5'RACE experiments and for decreased expression compared to that with isoform a (P1 and P2). In addition, such structures could also be at the origin for the deletions observed in isoforms a and c. Taken together, these results indicate that the P1 and P2 promoters both contribute to the expression of the bla(KPC) gene and that the construct with the highest level of expression is that possessing isoform a, which is also the most commonly encountered form in clinical isolates.


Figures

Fig 1
Fig 1
(A) Schematic structure of blaKPC-2 gene and surrounding insertion sequences ISkpn7 and ISkpn6. Genes and their corresponding transcription orientations are indicated by horizontal arrows. Black triangles represent the inverted repeats of ISKpn6 and ISKpn7. Small arrows and numbers above the sequence refer to the primers indicated in Table 1. (B) Nucleotide sequences illustrating observed variations in the genetic environment directly upstream of the blaKPC gene. Highlighted regions include the putative −35 and −10 regions of the three different promoters that we describe here (P1, P2, and P3). They also include the transcription start site (+1), the putative ribosome binding site (RBS), and the blaKPC start codon (ATG), as previously reported by Yigit et al. (26). Boxed sequences correspond to the promoter sequences previously described by Yigit et al. (P1) (26) and Roth et al. (P1, P2, and P3′) (23).
Fig 2
Fig 2
In silico modeling of RNA structure of intervening promoter sequences. Secondary structures of RNA were predicted using RNAfold (http://rna.tbi.univie.ac.at/cgi-bin/RNAfold.cgi). Grey sequences represent −10, −35, and +1 promoter sequences constituting promoter P1. Boxed sequences correspond to the sequence being left in Tn4401a (99-bp deletion). The bold, boxed G nucleotide corresponds to the +1 site for putative initiation of the P3 promoter.
Fig 3
Fig 3
Plasmid constructs used for expression studies. The entire blaKPC gene with its flanking regions was amplified by PCR from K. pneumoniae KN2303 (Tn4401b), K. pneumoniae YC (Tn4401a), and K. pneumoniae 475 (Tn4401c) and cloned into the PCR-ScriptCam vector, resulting in pKPCprom1,2,3, pKPCprom1,2, and pKPCprom2, respectively. The expression level of the blaKPC gene was measured by qRT-PCR for each construct (Table 2). Variations in expression levels are indicated by arrows: expression was 3- to 10-fold lower with pKPCprom1,2,3 and pKPCprom2 than with pKPCprom1,2. The expression levels were correlated with imipenem MICs determined using Etest. The role of the P3 promoter was evaluated with a construct in which P3 was located immediately upstream of the blaKPC gene. The imipenem MIC suggests that the blaKPC gene was not expressed with this construct. pKPCΔprom, in which only an RBS structure was present upstream of the blaKPC gene, was used as a negative control.

Similar articles

Cited by

References

    1. Ardanuy C, et al. 1998. Outer membrane profiles of clonally related Klebsiella pneumoniae isolates from clinical samples and activities of cephalosporins and carbapenems. Antimicrob. Agents Chemother. 42:1636–1640 - PMC - PubMed
    1. Bradford PA, et al. 2004. Emergence of carbapenem-resistant Klebsiella species possessing the class A carbapenem-hydrolyzing KPC-2 and inhibitor-resistant TEM-30 β-lactamases in New York City. Clin. Infect. Dis. 39:55–60 - PubMed
    1. Browning DF, Busby SJ. 2004. The regulation of bacterial transcription initiation. Nat. Rev. Microbiol. 2:57–65 - PubMed
    1. Clinical and Laboratory Standards Institute 2012. Performance standards for antimicrobial susceptibility testing; 21st informational supplement. CLSI M100-S21. Clinical and Laboratory Standards Institute, Wayne, PA
    1. Cuzon G, et al. 2010. Worldwide diversity of Klebsiella pneumoniae that produce β-lactamase blaKPC-2 gene. Emerg. Infect. Dis. 16:1349–1356 - PMC - PubMed

Publication types

MeSH terms

LinkOut - more resources