

Genome-wide mapping of cystitis due to Streptococcus agalactiae and Escherichia coli in mice identifies a unique bladder transcriptome that signifies pathogen-specific antimicrobial defense against urinary tract infection
- PMID: 22733575
- PMCID: PMC3418756
- DOI: 10.1128/IAI.00023-12
Genome-wide mapping of cystitis due to Streptococcus agalactiae and Escherichia coli in mice identifies a unique bladder transcriptome that signifies pathogen-specific antimicrobial defense against urinary tract infection
Abstract
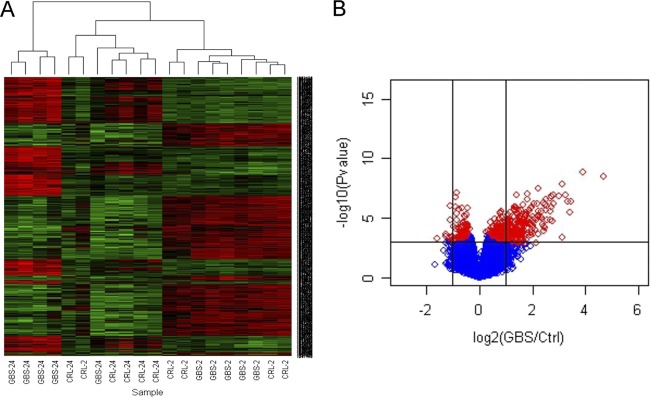
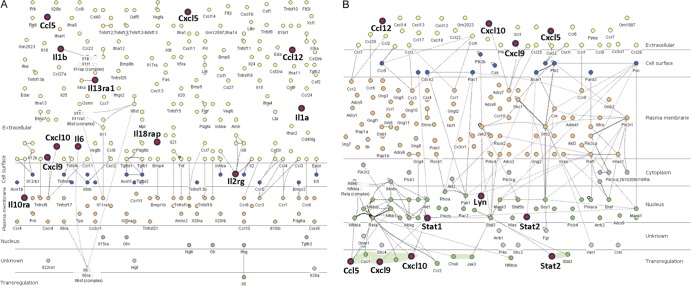
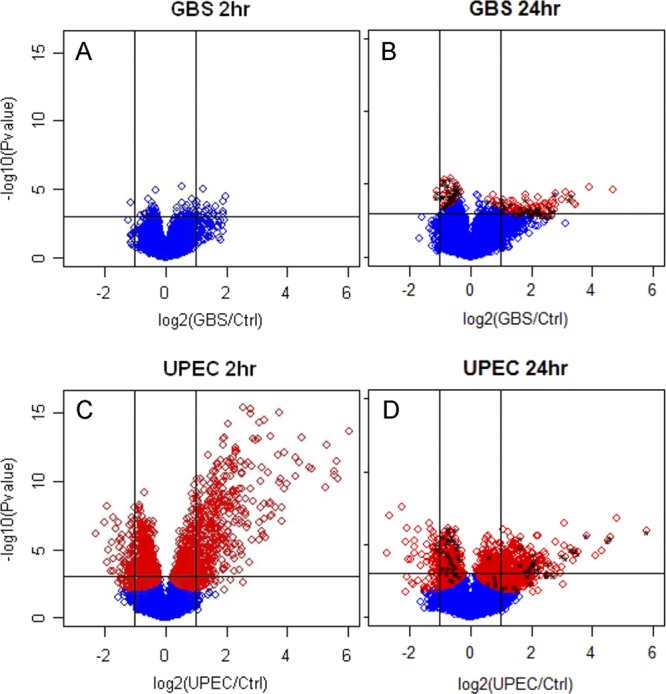
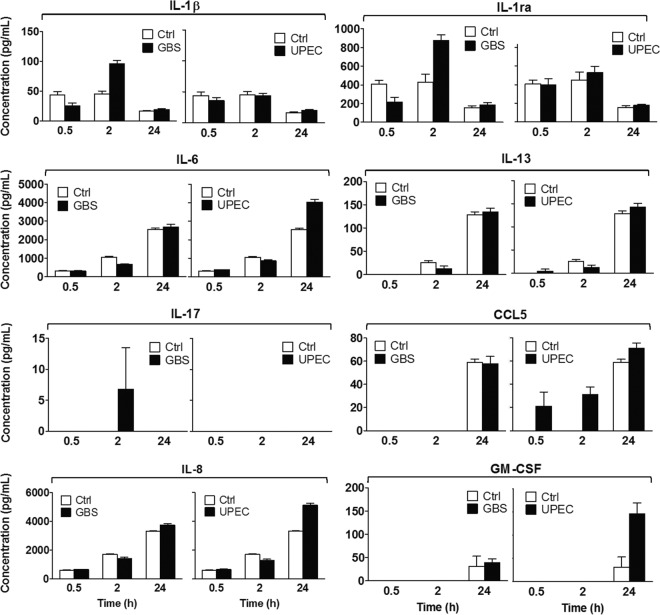
The most common causes of urinary tract infections (UTIs) are Gram-negative pathogens such as Escherichia coli; however, Gram-positive organisms, including Streptococcus agalactiae, or group B streptococcus (GBS), also cause UTI. In GBS infection, UTI progresses to cystitis once the bacteria colonize the bladder, but the host responses triggered in the bladder immediately following infection are largely unknown. Here, we used genome-wide expression profiling to map the bladder transcriptome of GBS UTI in mice infected transurethrally with uropathogenic GBS that was cultured from a 35-year-old women with cystitis. RNA from bladders was applied to Affymetrix Gene-1.0ST microarrays; quantitative reverse transcriptase PCR (qRT-PCR) was used to analyze selected gene responses identified in array data sets. A surprisingly small significant-gene list of 172 genes was identified at 24 h; this compared to 2,507 genes identified in a side-by-side comparison with uropathogenic E. coli (UPEC). No genes exhibited significantly altered expression at 2 h in GBS-infected mice according to arrays despite high bladder bacterial loads at this early time point. The absence of a marked early host response to GBS juxtaposed with broad-based bladder responses activated by UPEC at 2 h. Bioinformatics analyses, including integrative system-level network mapping, revealed multiple activated biological pathways in the GBS bladder transcriptome that regulate leukocyte activation, inflammation, apoptosis, and cytokine-chemokine biosynthesis. These findings define a novel, minimalistic type of bladder host response triggered by GBS UTI, which comprises collective antimicrobial pathways that differ dramatically from those activated by UPEC. Overall, this study emphasizes the unique nature of bladder immune activation mechanisms triggered by distinct uropathogens.
Figures
Similar articles
-
Immune modulation by group B Streptococcus influences host susceptibility to urinary tract infection by uropathogenic Escherichia coli.Infect Immun. 2012 Dec;80(12):4186-94. doi: 10.1128/IAI.00684-12. Epub 2012 Sep 17. Infect Immun. 2012. PMID: 22988014 Free PMC article.
-
Innate transcriptional networks activated in bladder in response to uropathogenic Escherichia coli drive diverse biological pathways and rapid synthesis of IL-10 for defense against bacterial urinary tract infection.J Immunol. 2012 Jan 15;188(2):781-92. doi: 10.4049/jimmunol.1101231. Epub 2011 Dec 19. J Immunol. 2012. PMID: 22184725
-
Host Cathelicidin Exacerbates Group B Streptococcus Urinary Tract Infection.mSphere. 2020 Apr 22;5(2):e00932-19. doi: 10.1128/mSphere.00932-19. mSphere. 2020. PMID: 32321824 Free PMC article.
-
Bad bugs and beleaguered bladders: interplay between uropathogenic Escherichia coli and innate host defenses.Proc Natl Acad Sci U S A. 2000 Aug 1;97(16):8829-35. doi: 10.1073/pnas.97.16.8829. Proc Natl Acad Sci U S A. 2000. PMID: 10922042 Free PMC article. Review.
-
Dynamic interactions between host and pathogen during acute urinary tract infections.Urology. 2001 Jun;57(6 Suppl 1):56-61. doi: 10.1016/s0090-4295(01)01130-x. Urology. 2001. PMID: 11378051 Review.
Cited by
-
Cathelicidin augments epithelial receptivity and pathogenesis in experimental Escherichia coli cystitis.J Infect Dis. 2015 Apr 1;211(7):1164-73. doi: 10.1093/infdis/jiu577. Epub 2014 Oct 21. J Infect Dis. 2015. PMID: 25336727 Free PMC article.
-
Burkholderia pseudomallei Capsule Exacerbates Respiratory Melioidosis but Does Not Afford Protection against Antimicrobial Signaling or Bacterial Killing in Human Olfactory Ensheathing Cells.Infect Immun. 2016 Jun 23;84(7):1941-1956. doi: 10.1128/IAI.01546-15. Print 2016 Jul. Infect Immun. 2016. PMID: 27091931 Free PMC article.
-
Role of capsule and O antigen in the virulence of uropathogenic Escherichia coli.PLoS One. 2014 Apr 10;9(4):e94786. doi: 10.1371/journal.pone.0094786. eCollection 2014. PLoS One. 2014. PMID: 24722484 Free PMC article.
-
The co-transcriptome of uropathogenic Escherichia coli-infected mouse macrophages reveals new insights into host-pathogen interactions.Cell Microbiol. 2015 May;17(5):730-46. doi: 10.1111/cmi.12397. Epub 2015 Jan 24. Cell Microbiol. 2015. PMID: 25410299 Free PMC article.
-
β-Hemolysin/cytolysin of Group B Streptococcus enhances host inflammation but is dispensable for establishment of urinary tract infection.PLoS One. 2013;8(3):e59091. doi: 10.1371/journal.pone.0059091. Epub 2013 Mar 7. PLoS One. 2013. PMID: 23505569 Free PMC article.
References
-
- Anderson BL, Simhan HN, Simons KM, Wiesenfeld HC. 2007. Untreated asymptomatic group B streptococcal bacteriuria early in pregnancy and chorioamnionitis at delivery. Am. J. Obstet. Gynecol. 196:524.e1-524.e5 - PubMed
-
- Baker CJ. 2000. Group B streptococcal infections, p 222–237 In Stevens DL, Kaplan EL. (ed), Streptococcal infections. Clinical aspects, microbiology, and molecular pathogenesis. Oxford University Press, New York, NY
-
- Barry WT, Nobel AB, Wright FA. 2005. Significance analysis of functional categories in gene expression studies: a structured permutation approach. Bioinformatics 21:1943–1949 doi:10.1093/bioinformatics/bti260 - DOI - PubMed
-
- Bender L, et al. 2008. Early and late markers for the detection of early-onset neonatal sepsis. Dan. Med. Bull. 55:219–223 - PubMed
Publication types
MeSH terms
Grants and funding
LinkOut - more resources
Full Text Sources
Medical
Molecular Biology Databases
