

doi: 10.1073/pnas.1118138109.
Epub 2012 Jun 25.
p85β phosphoinositide 3-kinase subunit regulates tumor progression
Affiliations
- PMID: 22733740
- PMCID: PMC3396516
- DOI: 10.1073/pnas.1118138109
Item in Clipboard
p85β phosphoinositide 3-kinase subunit regulates tumor progression
Proc Natl Acad Sci U S A.
.
Abstract
PIK3R2 encodes a ubiquitous regulatory subunit (p85β) of PI3K, an enzyme that generates 3-polyphosphoinositides at the plasma membrane. PI3K activation triggers cell survival and migration. We found that p85β expression is elevated in breast and colon carcinomas and that its increased expression correlates with PI3K pathway activation and tumor progression. p85β expression induced moderate PIP(3) generation at the cell membrane and enhanced cell invasion. In accordance, genetic alteration of pik3r2 expression levels modulated tumor progression in vivo. Increased p85β expression thus represents a cellular strategy in cancer progression.
Conflict of interest statement
The authors declare no conflict of interest.
Figures
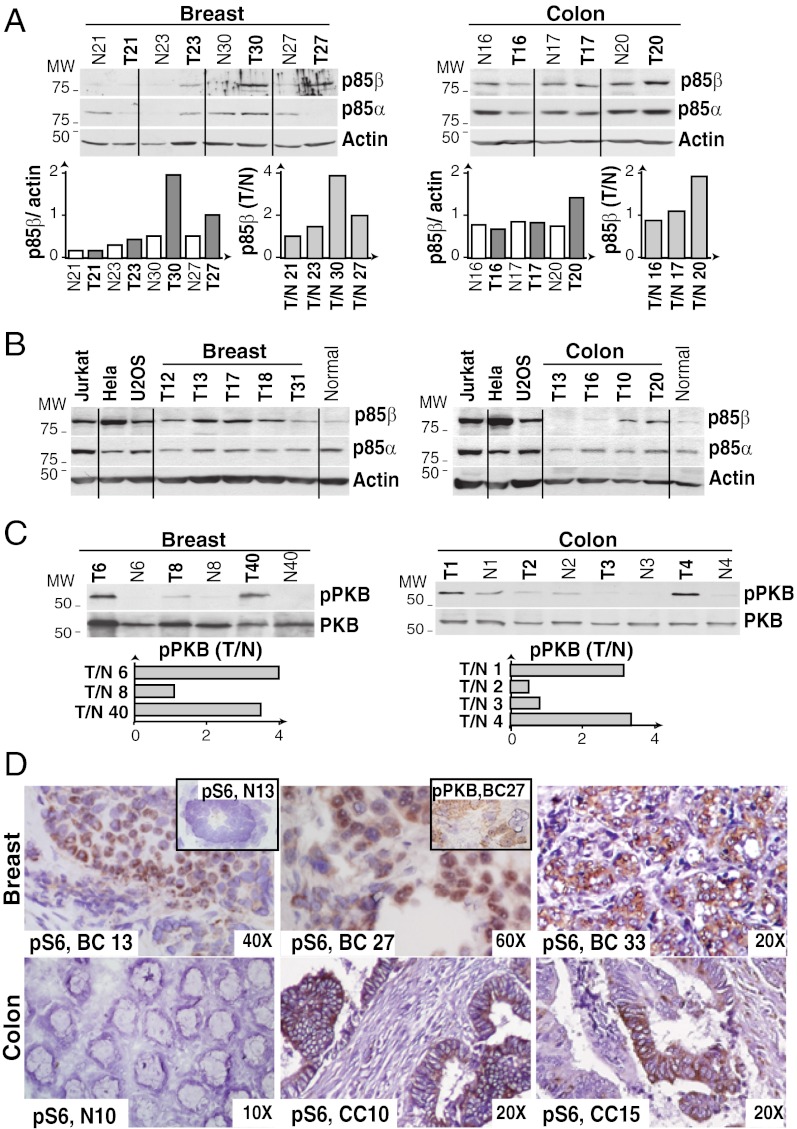
Increased p85β expression in breast and colon carcinomas. (A–C) Extracts from representative CC and BC tumors (T), surrounding normal tissue (N), and control cells (panel B) were examined by WB using anti-p85α or anti-p85β Ab (A and B) or anti-pPKB or anti-PKB Ab (C). Graphs show actin-normalized p85β WB signal intensity in each sample, and the increase in p85β levels in T vs. N ratio (A) or the ratio of pPKB signal normalized to PKB in T vs. N (C). (D) IH of tumor samples using anti-pS6 Ab. BC 13 and 33 show intense staining (score 2.5 of 3) in ∼70% of tumor cells; BC 27 shows intermediate staining (score 2) in ∼50% of the cells. Inset: Normal acinus and BC27 IH using anti-pPKB Ab. Lower: Normal tissue, intense staining in CC10 (score 3, 50% of cells) and intermediate staining in CC15 (score 2, ∼45% of cells). Original magnification is indicated.
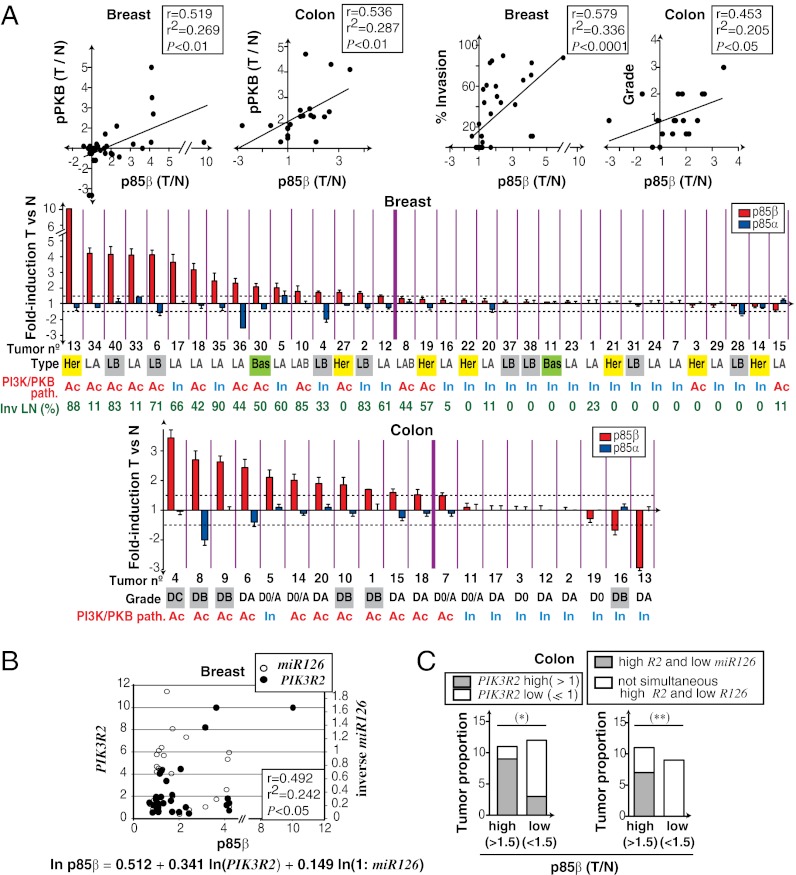
Increased p85β expression and PI3K pathway activation in advanced tumors. (A) Pearson correlation of p85β [tumor (T)/normal (N) ratio] vs. pPKB/PKB (T/N ratio) levels or vs. percentage of invaded LN (breast) or tumor grade (colon). For CC correlation, grade D0 is 0, D0/A is 1.5, DA is 1, DB is 2, and DC is 3. Color graphs show results for p85α and p85β protein expression (T vs. N; mean ± SD, triplicate WB). Horizontal dashed lines indicate a p85β expression change greater or lower than 1.5-fold. Thick vertical line separates tumors with >1.5-fold increase in p85β. Beneath the graphs, tumor number, PI3K/PKB pathway status (Ac, active; In, inactive), CC grade (Dukes grade) or BC type (LA, LB, luminal A or B; LAB, luminal; Her, HER2-positive; Bas, basal), and percentage of invaded lymph nodes (LNs) are indicated. (B) Multiple linear regression analysis of p85β (T/N ratio) dependence on PIK3R2 mRNA and miR126 levels in BC. We used relative quantity values for PIK3R2 mRNA and relative quantity values−1 for miR126. Variables were transformed by the function ln(x + 1). (C) CC samples grouped by p85β levels were compared with samples with low or high PIK3R2 mRNA levels (Left) or with simultaneous high PIK3R2 and low miR126 levels (≤1; Right). *P < 0.05 and **P < 0.01 by Fisher exact test.
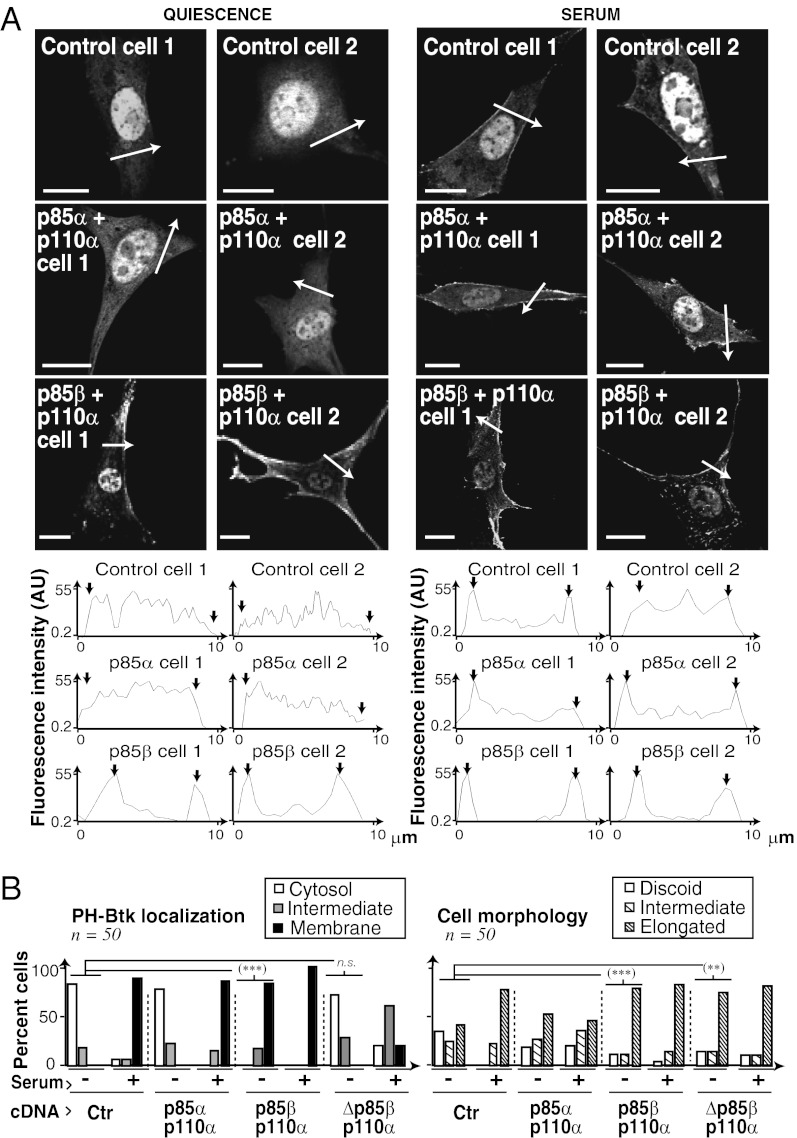
p85β enhances plasma membrane PIP3 levels. (A) NIH 3T3 cells were cotransfected with GFP-Btk-PH and cDNAs encoding p85α/p110α or p85β/p110α (24 h), then incubated in serum-free medium for 2 h (Left); some were activated with serum for 15 min (Right). PIP3 localization (Btk-PH signal) was analyzed by fluorescence microscopy. Graphs show fluorescence intensity [in arbitrary units (AU)] in the sections indicated by white arrows. Arrows in graphs indicate the cell membrane. (B) Graphs show the percentage of cells with PIP3 signal at cell membrane, cytosol, or both, and the percentage of cells with discoid, elongated, or intermediate morphology. (Scale bar: 15 μm.) ***P < 0.001 and **P < 0.01 by χ2 test.
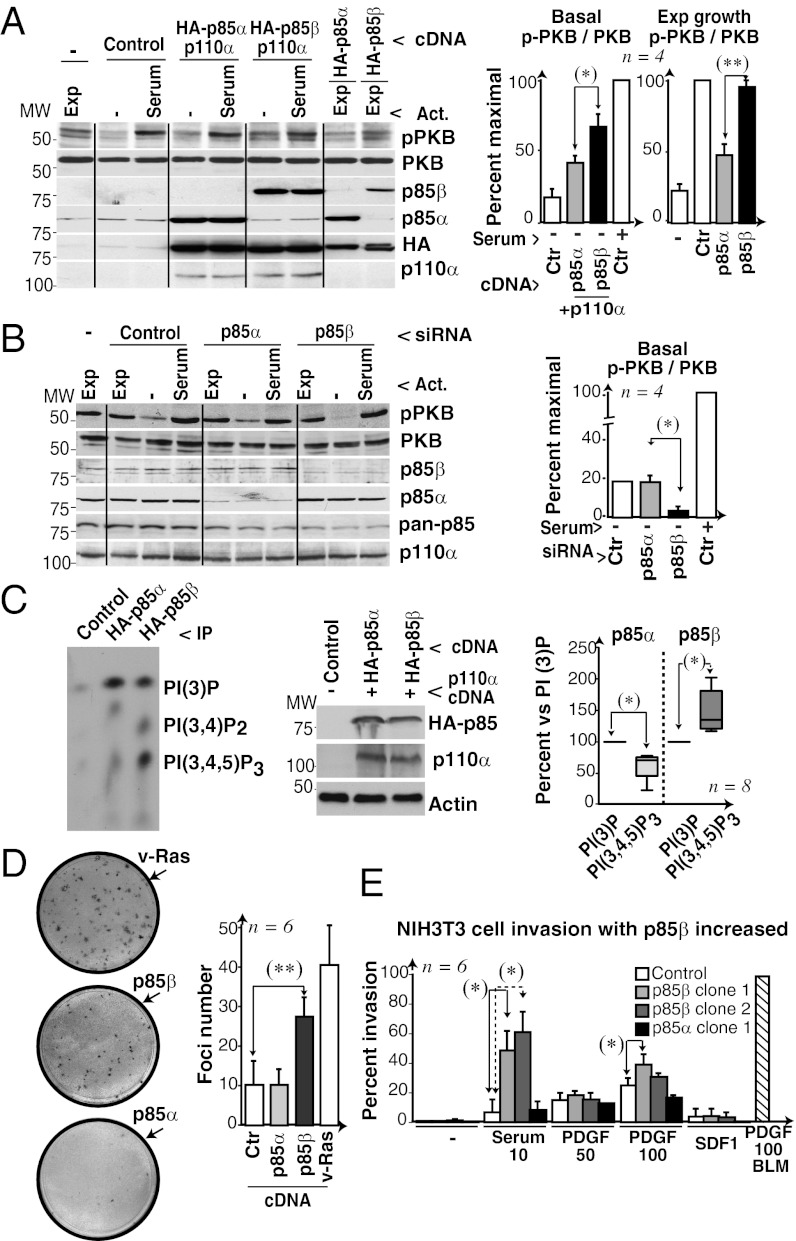
Enhanced PI3K pathway activation in p85β-expressing cells. (A) U2OS cells transfected with HA-p85α or -β alone or in combination with p110α (48 h) were serum-deprived (2 h); some were then serum-stimulated (10%, 10 min), and other samples were maintained in exponential growth (Exp). PI3K and p-PKB levels were tested by WB. Graphs show the percentage of signal in each lane compared with maximum (100%, control cells with serum). (B) U2OS cells were transfected with control, p85β, or p85α siRNA (48 h) and tested as in A. (C) Extracts from COS-7 cells transfected with HA-p85α/p110α or HA-p85β/p110α (48 h) were analyzed by WB or IP with anti-HA Ab and tested in a kinase assay by using a mixture of PtdIns, PtdIns (4)P, and PtdIns (4,5)P2. Graphs show the PtdIns (3,4,5)P3 signal compared with the PtdIns (3)P signal (100%; mean ± SD, n = 8). (D) Representative focus formation assay of NIH 3T3 cells transfected with p85α, p85β, or V12-Ras (positive control); the graph shows mean focus number ± SD (n = 6 assays). (E) Percent matrigel invasion by NIH 3T3 cell lines expressing p85α or p85β compared with maximum (BLM cells with 100 ng/mL PDGF). Invasion assays (n = 6) were performed in serum (10% or 20%), PDGF (in ng/mL as indicated) or SDF1 (100 ng/mL). *P < 0.05 and **P < 0.01 by Student t test.
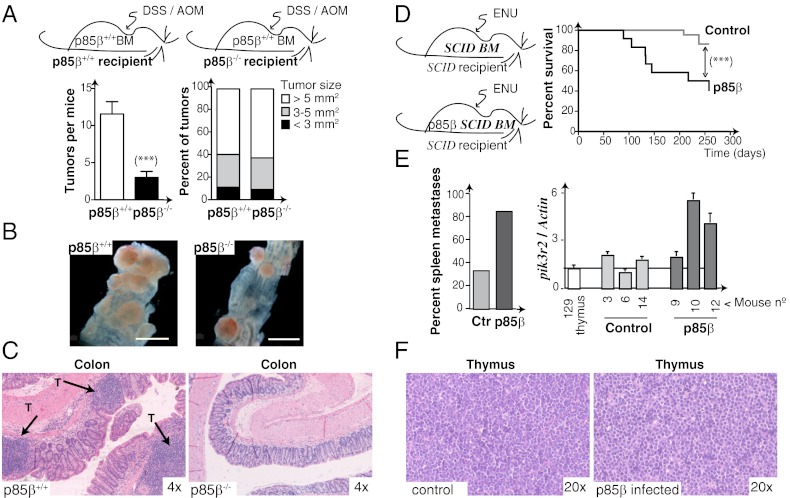
p85β controls tumor progression in vivo. (A) Colon carcinogenesis was induced by AOM/DSS treatment of p85β+/+ and p85β−/− mice 1 mo after transplantation with WT (p85β+/+) BM. Tumor multiplicity and size in p85β+/+ and p85β−/− mice after AOM/DSS treatment (mean ± SD, n = 12; ***P < 0.001 by Student t test). (B) Representative images from p85β+/+ and p85β−/− mice showing tumors in the distal colon. (Scale bar: 5 mm.) (C) H&E-stained colon sections show tumors in AOM/DSS-treated p85β+/+ and p85β−/− mice. Arrows indicate tumor masses (T). (D) Lymphomagenesis was induced in SCID mice after transplantation with control or p85β-infected BM, followed by ENU treatment (Left). Kaplan–Meier survival curves (Right); ***P < 0.001 by Mantel–Cox test (n = 15 p85β, n = 22 controls). (E) Percentage of mice with spleen metastases of the thymic lymphoma (Left). qPCR shows pikr2 expression in control and p85β-transduced SCID mice tumors (Right). (F) Thymic lymphomas from control or p85β-transduced SCID mouse. Original magnification indicated.
References
-
- Marone R, Cmiljanovic V, Giese B, Wymann MP. Targeting PI3K: Moving towards therapy. Biochim Biophys Acta. 2008;1784:159–185. - PubMed
-
- Kok K, Geering B, Vanhaesebroeck B. Regulation of PI3K expression in health and disease. Trends Biochem Sci. 2009;34:115–127. - PubMed
-
- Fruman DA, Cantley LC, Carpenter CL. Structural organization and alternative splicing of the murine PI3K p85 alpha gene. Genomics. 1996;37:113–121. - PubMed
Publication types
MeSH terms
Substances
LinkOut - more resources
Full Text Sources
Other Literature Sources
Molecular Biology Databases
Miscellaneous
