. 2012 Jul 31;109(31):12668-73.
doi: 10.1073/pnas.1203692109. Epub 2012 Jun 25.

IL-7 receptor blockade reverses autoimmune diabetes by promoting inhibition of effector/memory T cells

Affiliations

IL-7 receptor blockade reverses autoimmune diabetes by promoting inhibition of effector/memory T cells

Cristina Penaranda et al. Proc Natl Acad Sci U S A. .

Abstract

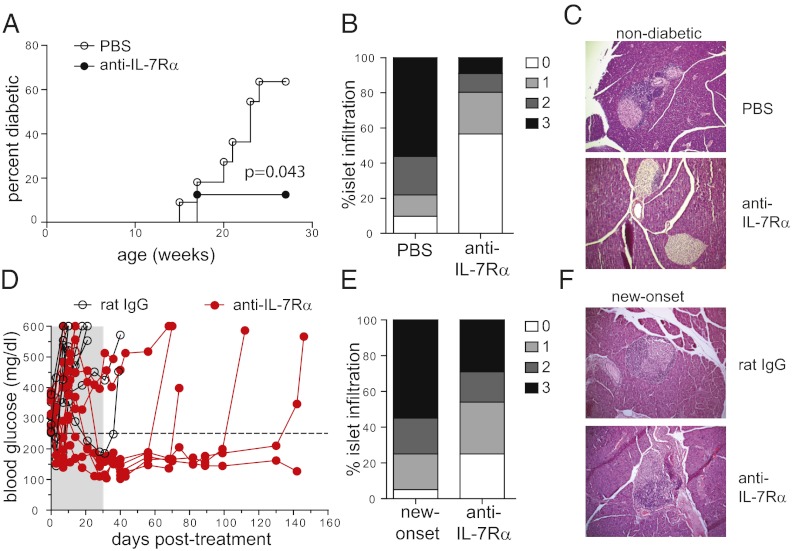
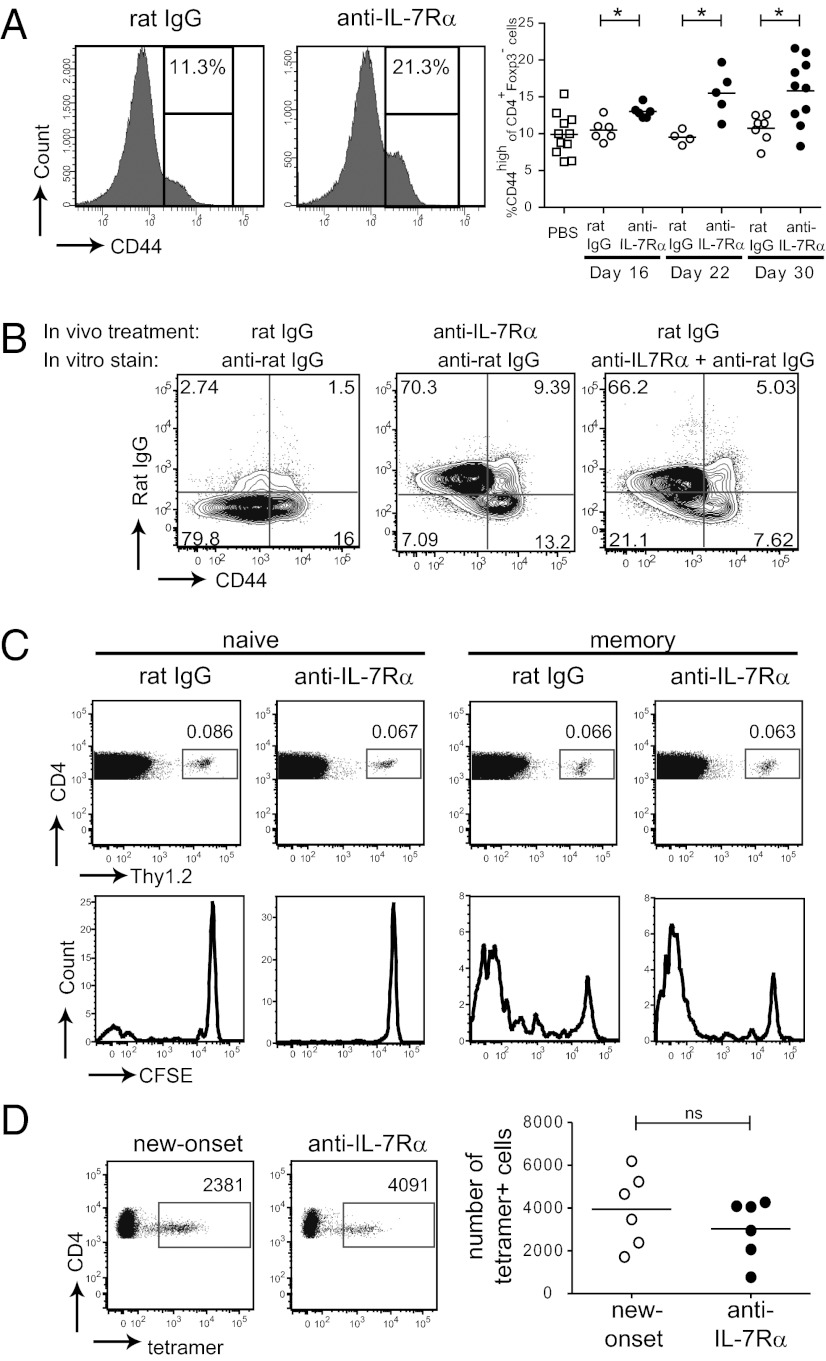
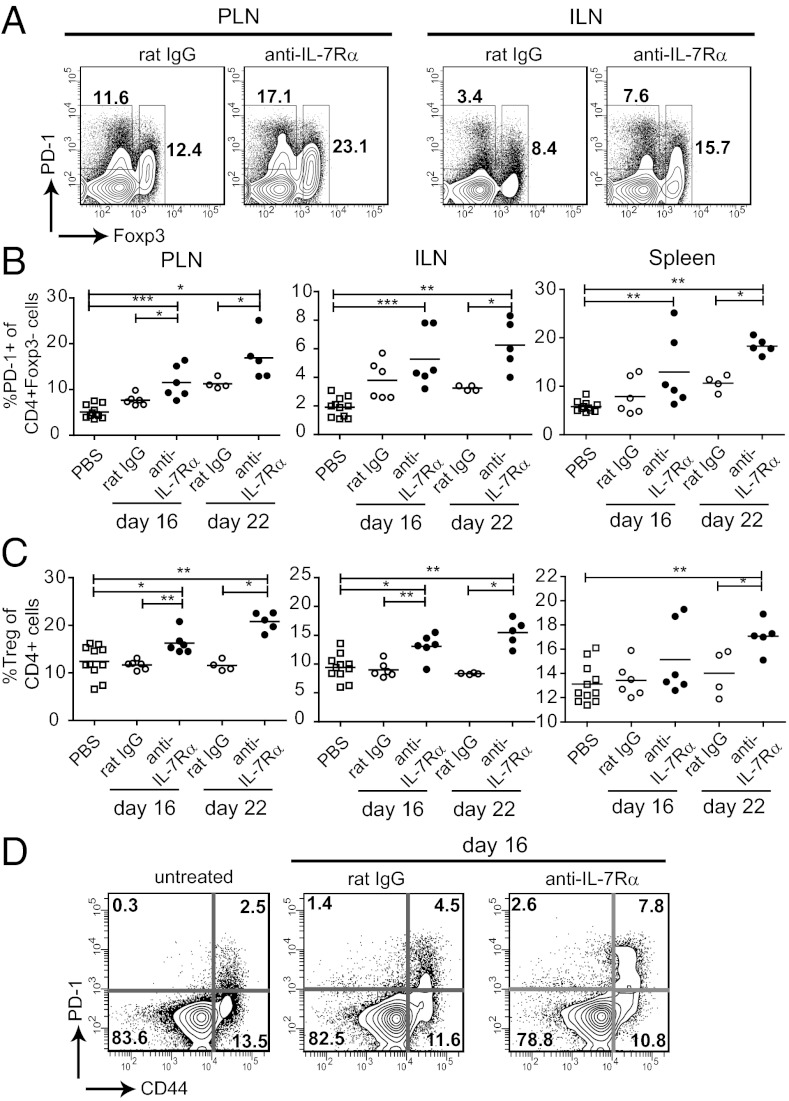
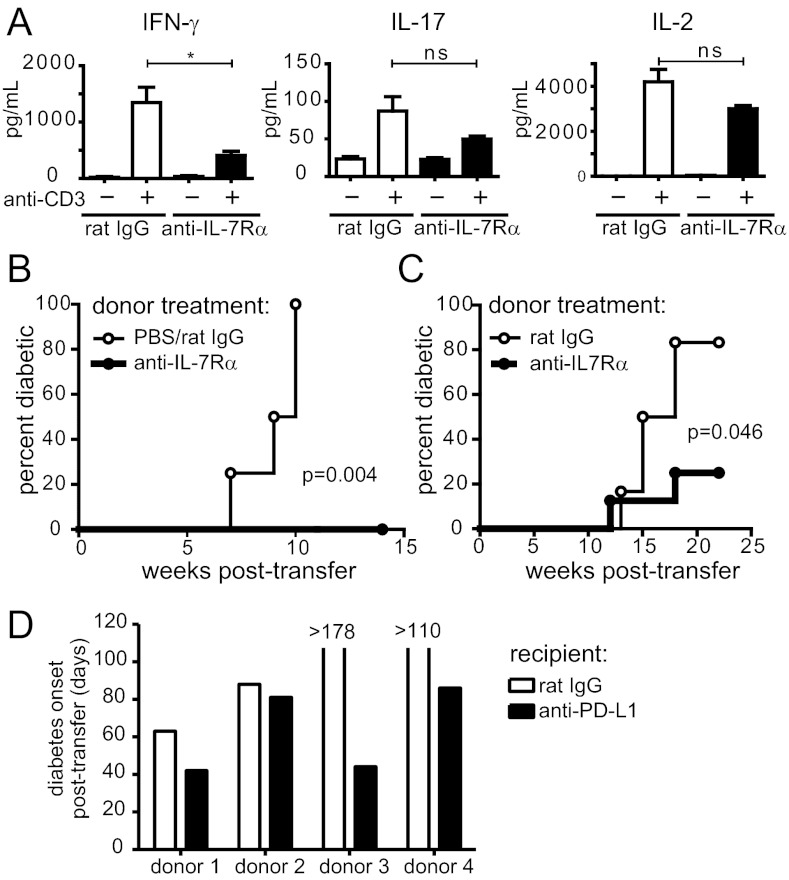
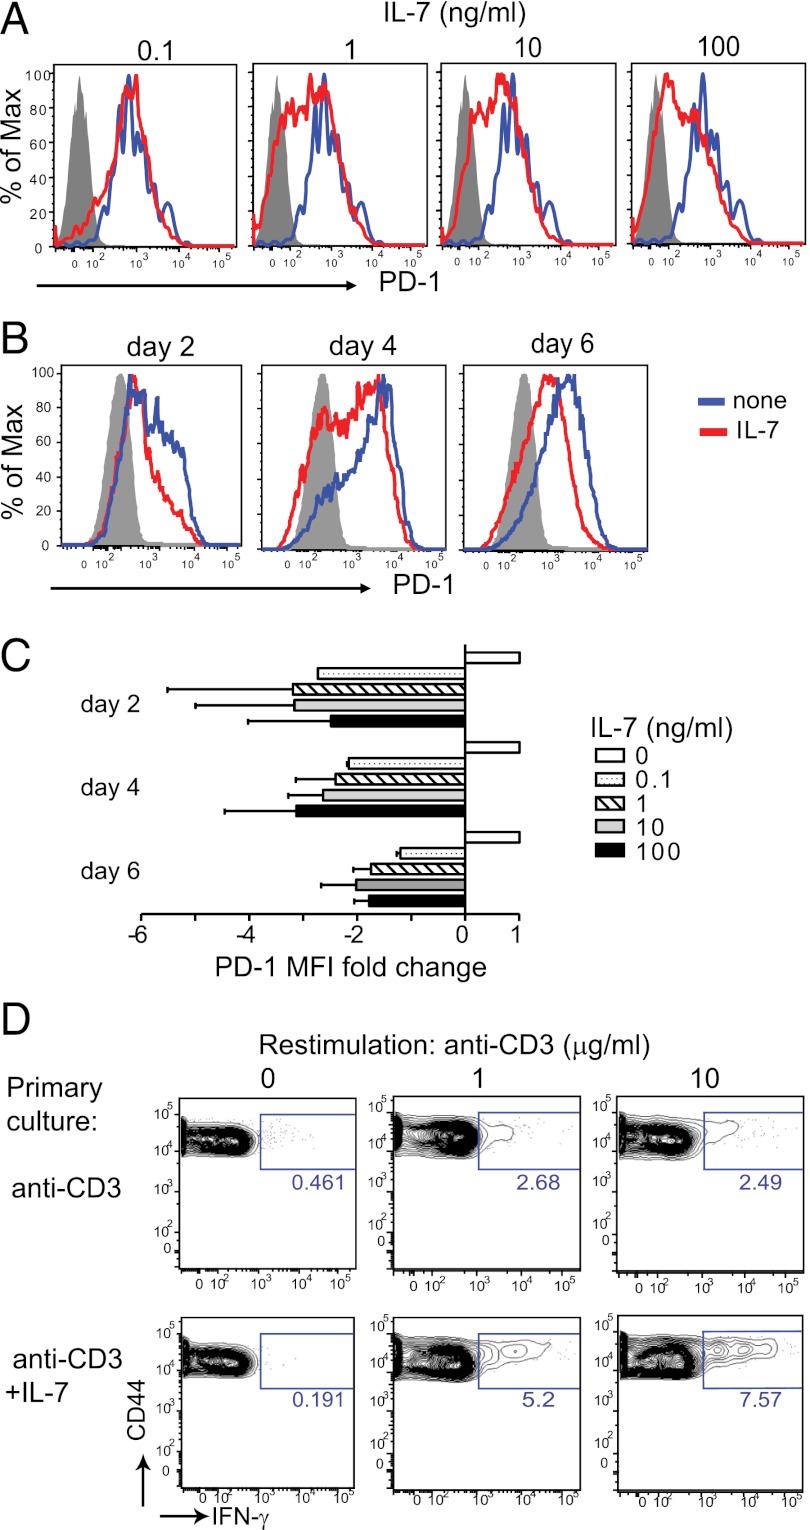
To protect the organism against autoimmunity, self-reactive effector/memory T cells (T(E/M)) are controlled by cell-intrinsic and -extrinsic regulatory mechanisms. However, how some T(E/M) cells escape regulation and cause autoimmune disease is currently not understood. Here we show that blocking IL-7 receptor-α (IL-7Rα) with monoclonal antibodies in nonobese diabetic (NOD) mice prevented autoimmune diabetes and, importantly, reversed disease in new-onset diabetic mice. Surprisingly, IL-7-deprived diabetogenic T(E/M) cells remained present in the treated animals but showed increased expression of the inhibitory receptor Programmed Death 1 (PD-1) and reduced IFN-γ production. Conversely, IL-7 suppressed PD-1 expression on activated T cells in vitro. Adoptive transfer experiments revealed that T(E/M) cells from anti-IL-7Rα-treated mice had lost their pathogenic potential, indicating that absence of IL-7 signals induces cell-intrinsic tolerance. In addition to this mechanism, IL-7Rα blockade altered the balance of regulatory T cells and T(E/M) cells, hence promoting cell-extrinsic regulation and further increasing the threshold for diabetogenic T-cell activation. Our data demonstrate that IL-7 contributes to the pathogenesis of autoimmune diabetes by enabling T(E/M) cells to remain in a functionally competent state and suggest IL-7Rα blockade as a therapy for established T-cell-dependent autoimmune diseases.


Conflict of interest statement

The authors declare no conflict of interest.

Figures

Fig. 1.
Fig. 1.
IL-7Rα blockade prevents and reverses diabetes in NOD mice. (A) Female NOD mice were treated with anti–IL-7Rα monoclonal antibodies (n = 8) or PBS (n = 11) for 14 wk, starting at 10 wk of age, and diabetes incidence was followed. (B) Infiltration of pancreatic islets in 24-wk-old nondiabetic mice from A quantified as percentages of islets showing the indicated histological scores (see Materials and Methods) (PBS, n = 3; anti–IL-7Rα, n = 6). (C) Representative pictures of islets in 24-wk-old, nondiabetic mice from A at 20× magnification. (D) New-onset diabetic NOD mice [blood glucose between 250–400 mg/dL (dotted line)] were treated with anti–IL-7Rα antibodies (n = 10) or rat IgG (n = 9) for 4 wk (shaded area). Blood-glucose levels were followed for up to 5 mo. (E) Histological scores of new-onset NOD mice that became normoglycemic after anti–IL-7Rα treatment compared with untreated new-onset mice. (F) Representative pictures of islets in new-onset mice or mice cured after anti–IL-7Rα treatment at 20× magnification.
Fig. 2.
Fig. 2.
IL-7Rα blockade does not preferentially deplete islet-reactive TE/M cells. (A) Prediabetic NOD mice (10–12 wk) were treated twice a week with anti–IL-7Rα or rat IgG antibodies for the indicated periods of time and the percentage of CD44high cells within the CD4+Foxp3 population in the PLNs was determined by flow cytometry. Representative histograms (Left) and pooled data from five independent experiments (Right) are shown. Each symbol represents an individual mouse. *P ≤ 0.05. (B) NOD mice were treated for 4 wk, as indicated, and lymphoid organs were harvested and stained with anti-rat IgG antibodies. Dot plots show the presence of anti–IL-7Rα antibodies on the cell surface of CD44high and CD44low CD25CD4+ T cells from PLNs. Results are representative for two independent experiments (n = 3–4 mice per group). (C) 7.5 × 10⁵ CFSE-labeled CD44low (naïve) or CD44high (memory) CD4+Thy1.2+ T cells were transferred to NOD.Thy1.1 recipients and treated with rat IgG or anti–IL-7Rα. Dot plots show percentage of CD4+Thy1.2+ cells present within the CD4+ population in the PLNs after 4 wk of treatment and histograms show CFSE dilution, as a measure of cell division, in transferred cells. Data are representative of two independent experiments (n = 2 mice per group). (D) Quantification of islet antigen-specific CD4+ T cells present in the lymphoid organs of new-onset and anti–IL-7Rα-cured mice from Fig. 1E, determined by BDC2.5-reactive tetramer staining and flow cytometry; ns, not significant.
Fig. 3.
Fig. 3.
Absence of IL-7 signals increases numbers of PD-1+ and Foxp3+CD4+ T cells. Prediabetic NOD mice (10–12 wk) were treated with anti–IL-7Rα or rat IgG antibodies for 16–22 d and the PLNs and ILNs and spleen were stained for CD4, Foxp3, and PD-1. (A) Dot plots show the gates used to determine the percentages (values indicated) of CD4+Foxp3+ Tregs, and PD-1+ cells within the CD4+Foxp3 T-cell population. (B and C) Summary of percentages of PD-1+ and Foxp3+ CD4+ T cells, respectively. Each symbol represents an individual mouse. Data are pooled from three independent experiments. *P ≤ 0.05; **P ≤ 0.005; ***P ≤ 0.0005. (D) Dot plots show representative PD-1 staining on naïve (CD44low) and memory (CD44high) CD4+Foxp3neg T cells.
Fig. 4.
Fig. 4.
CD4+ T cells isolated from anti–IL-7Rα-treated mice lose effector function and diabetogenicity. (A) Prediabetic NOD mice were treated for 10 d with anti–IL-7Rα antibodies or rat IgG and 1 × 10⁵ CD4+ T cells isolated from lymph nodes and spleen were restimulated with anti-CD3 (1 μg/mL) and bone marrow-derived dendritic cells (1 × 10⁵) for 15 h. Supernatants were collected and cytokines detected by ELISA. Results are pooled from two independent experiments (n = 6). *P ≤ 0.05; ***P ≤ 0.0005; ns, not significant. (B) CD25CD44highCD4+ TE/M cells were isolated from lymph nodes and spleen of anti–IL-7Rα– (n = 5) or control-treated (n = 4) nondiabetic NOD mice and 2.5 × 10⁵ (experiment 1) or 1.2 × 10⁶ (experiment 2) cells from individual donors were transferred to NOD.SCID recipients. Diabetes incidence was followed without further antibody treatment of the recipients. Graph shows pooled data from two independent experiments. P = 0.004. (C) Total CD25CD4+ T cells were isolated from prediabetic (14-wk-old) NOD mice that were treated for 2–4 wk with anti–IL-7Rα (n = 8) or rat IgG (n = 6) and 3.7 × 10⁶ cells from individual mice were transferred to NOD.SCID recipients and diabetes incidence followed in the absence of further antibody treatment. Graph shows pooled data from two independent experiments. P = 0.046. (D) CD44high CD4+ TE/M cells were isolated from new-onset diabetic NOD mice that were cured with anti–IL-7Rα blockade, as in Fig. 1D. The 5 × 10⁵ TE/M cells isolated from each individual donor were split in two and adoptively transferred to two NOD.SCID recipients. Matching recipients were treated with rat IgG or anti–PD-L1 antibodies and graph shows days to diabetes onset for each individual treated vs. control pair. Mice that did not become diabetic were killed on the indicated days. P < 0.0001.
Fig. 5.
Fig. 5.
IL-7 inhibits PD-1 expression in vitro. Naïve PD-1Foxp3CD4+ T cells (gray, filled) were isolated from NOD/Foxp3-GFP mice and stimulated in vitro with anti-CD3 (10 μg/mL) + anti-CD28 (1 μg/mL) antibodies with (red) or without (blue) the indicated amounts of recombinant IL-7. (A) Histograms show PD-1 expression on activated (CD44high) T cells in the presence of increasing amounts of IL-7 and (B) at different times after stimulation with and without IL-7 (10 ng/mL). (C) Graph shows fold change in mean fluorescent intensity (MFI) of PD-1 staining relative to the normalized value (= 1) of cultures without IL-7. Data are pooled from four independent experiments. (D) Cells were stimulated for 6 d with or without IL-7 (10 ng/mL), as in A and, after harvesting and washing, restimulated with anti-CD3 mAb and splenocytes for 18 h (in the presence of BFA for the last 5 h). Dot plots show IFN-γ production determined by intracellular cytokine staining. Results are representative for two independent experiments.

Comment in

References

    1. Bluestone JA, Herold K, Eisenbarth G. Genetics, pathogenesis and clinical interventions in type 1 diabetes. Nature. 2010;464:1293–1300. - PMC - PubMed
    1. Surh CD, Sprent J. Homeostasis of naive and memory T cells. Immunity. 2008;29:848–862. - PubMed
    1. Pellegrini M, et al. Adjuvant IL-7 antagonizes multiple cellular and molecular inhibitory networks to enhance immunotherapies. Nat Med. 2009;15:528–536. - PubMed
    1. Pellegrini M, et al. IL-7 engages multiple mechanisms to overcome chronic viral infection and limit organ pathology. Cell. 2011;144:601–613. - PubMed
    1. Keir ME, et al. Tissue expression of PD-L1 mediates peripheral T cell tolerance. J Exp Med. 2006;203:883–895. - PMC - PubMed

Publication types

MeSH terms