. 2012 Jul 31;109(31):12674-9.
doi: 10.1073/pnas.1203795109. Epub 2012 Jun 25.

Anti-IL-7 receptor-α reverses established type 1 diabetes in nonobese diabetic mice by modulating effector T-cell function

Affiliations

Anti-IL-7 receptor-α reverses established type 1 diabetes in nonobese diabetic mice by modulating effector T-cell function

Li-Fen Lee et al. Proc Natl Acad Sci U S A. .

Erratum in

  • Proc Natl Acad Sci U S A. 2012 Oct 2;109(40):16393

Abstract

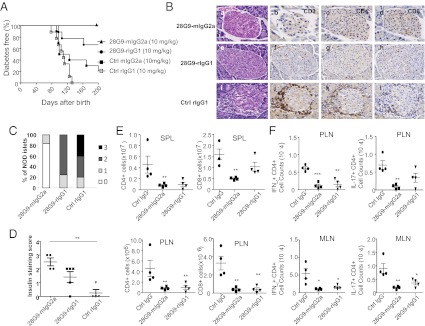
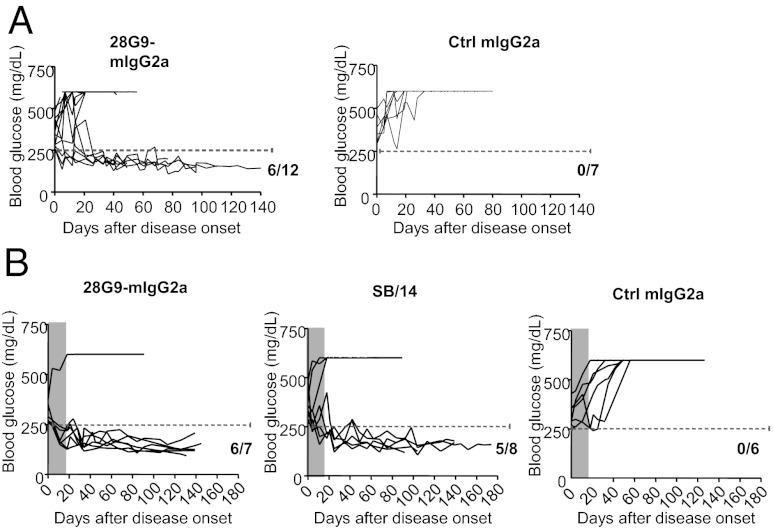
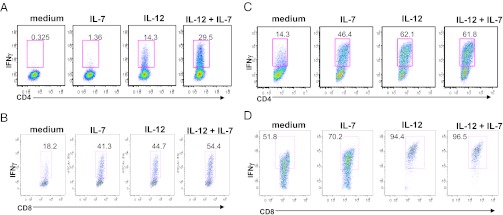
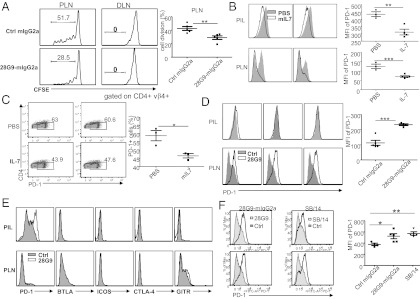
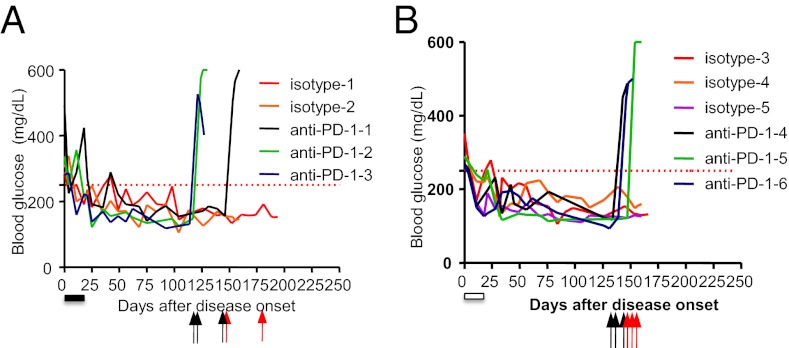
Genetic variation in the IL-7 receptor-α (IL-7R) gene is associated with susceptibility to human type 1 diabetes (T1D). Here we investigate the therapeutic efficacy and mechanism of IL-7Rα antibody in a mouse model of T1D. IL-7Rα antibody induces durable, complete remission in newly onset diabetic mice after only two to three injections. IL-7 increases, whereas IL-7Rα antibody therapy reduces, the IFN-γ-producing CD4(+) (T(H)1) and IFN-γ-producing CD8(+) T cells. Conversely, IL-7 decreases and IL-7Rα antibody enhances the inhibitory receptor Programmed Death 1 (PD-1) expression in the effector T cells. Programmed Death 1 blockade reversed the immune tolerance mediated by the IL-7Rα antibody therapy. Furthermore, IL-7Rα antibody therapy increases the frequency of regulatory T cells without affecting their suppressor activity. The durable efficacy and the multipronged tolerogenic mechanisms of IL-7Rα antibody therapy suggest a unique disease-modifying approach to T1D.


Conflict of interest statement

The authors declare no conflict of interest.

Figures

Fig. 1.
Fig. 1.
IL-7Rα antibody show antidiabetic efficacy in the prophylactic treatment. (A) Diabetes incidence in NOD mice treated with 10 mg/kg of 28G9-mIgG2a (n = 10), 28G9 (rat IgG1), mIgG2a (n = 10), or rat IgG1 (n = 9), starting at 9 wk of age until 29 wk of age, at which time the tissues were analyzed. Data are from one representative experiment of two independent experiments: 28G9-mIgG2a vs. mIgG2a P = 0.001; 28G9-mIgG2a vs. rat IgG1 P < 0.001; 28G9-rIgG1 vs. rat IgG1 P = 0.001; 28G9-rIgG1 vs. mIgG2a P = 0.037; and with P > 0.05 for all of the rest of pair comparison (Log-rank test). (B) Histological and immunohistochemical analysis of insulitis in mice treated with (a–d) 28G9-mIgG2a, (e–h) 28G9-rIgG1, (i–l) control IgG; (a, e, and i) H&E staining. Immunostaining of distinct cell subsets was performed using mAbs against CD3 (b, f, j), CD4 (c, g, k), and CD8 (d, h, l) at 29 wk of age. (Magnification: 20×.) (C) Intraislet infiltration in 28G9-mIgG2a, 28G9-rIgG1, or isotype control-treated mice was quantified histologically at 20–30 wk of age. The graph shows the fraction of islets with no infiltration (0), peri-insulitis (1), moderate insulitis with <50% islet area infiltrated (2), or severe insulitis with >50% islet area infiltrated (3), respectively. Data are from six to nine mice per group. (D) Insulin-staining score from treated animals, n = 4–5 from two experiments. Data in C and D are from one representative experiment of two independent experiments including four animals per group. (E) Absolute cell counts of CD4+, CD8+ from spleen (SPL) and PLN of 28G9-mIgG2a, 28G9-rIgG1, or IgG control-treated mice at 12 wk of age. (F) Absolute cell counts of IFN-γ+CD4+, IL-17+CD4+ from mesenteric lymph node (MLN) and PLN of 28G9-mIgG2a, 28G9-rIgG1, or isotype control at 12-wk of age. *P < 0.05, **P < 0.01, ***P < 0.001 (one-way ANOVA with post tests relative to the control IgG group).
Fig. 2.
Fig. 2.
Diabetes remission induced by IL-7Rα antibody therapy after disease onset. (A) Newly onset diabetic NOD mice (based on two consecutive blood-glucose concentrations over 250 mg/dL) were treated with 10 mg/kg of 28G9-mIgG2a (n = 12) or control IgG (n = 7) once a week. Blood glucose was monitored. (B). Another cohort of newly onset diabetic NOD mice were treated with 10 mg/kg of 28G9-mIgG2a (n = 7), or SB/14 (n = 8), or isotype control (n = 6) once a week for 3 wk. Gray-shaded areas indicate the treatment period. 28G9-mIgG2a vs. Ctrl IgG P = 0.004; SB/14 vs. Ctrl IgG P = 0.028; 28G9 vs. SB/14 P = 0.33, Fisher’s exact test.
Fig. 3.
Fig. 3.
IL-7 promotes IFN-γ+ cell development from NOD naïve CD4+ and CD8+ T cells. (A) Sorted naïve CD4+ and (B) CD8+ T cells from NOD mice were stimulated for 3 d with anti-CD3/CD28 activation beads in the presence of indicated cytokines. (C and D) After 3 d of culture in the presence of indicated cytokine shown in A, cells were rested for 48 h followed by restimulation with anti-CD3 and anti-CD28 in the presence of different cytokines (e.g., IL-12, IL-7, IL-7+IL-12), or medium as indicated for each individual FACS plot during the expansion period. CD4+ T cells (A and C) or CD8+ T cells (B and D) were analyzed for IFN-γ by flow cytometry.
Fig. 4.
Fig. 4.
IL-7 suppresses, whereas IL-7Rα antibody up-regulates, PD-1 in Teffs. (A) Proliferation of CFSE-labeled T cells isolated from 28G9-mIgG2a or control IgG treated BDC2.5 mice after adoptive transfer into NOD.Rag−/− mice. Flow cytometry was performed 7 d after transfer into NOD.Rag−/− in PLNs and the draining lymph node (DLN). Proliferation percentage was determined by CFSE dilution in CD4+Vβ4+ T cells. (B–E) Expression of PD-1 (x-axis of the FACS plots) by the PIL T cells or PLNs CD4+FoxP3 (Teff) cells. (B) Mice treated with PBS (gray) or 1 μg of mIL-7 (white) every other day for a total of three injections starting at 9 wk of age. (C) Lymph node T cells were isolated from NOD mice and treated with anti-CD3 and anti-CD28 in the presence of PBS or mIL-7 in vitro for 3 d. (D and E) Mice were treated once a week with control IgG-mIgG2a (gray) or 28G9-mIgG2a (white) starting at 9 wk-of-age (D) or at 12 wk-of-age (E) for 3 consecutive weeks. Graphs are representative of two independent experiments. (F) PD-1 expression in the PLN Teffs. NOD mice were treated with 28G9-mIgG2a, SB/14 or control IgG starting at 9 wk of age, each at 10 mg/kg per week for 4 wk. Mean flouorescence intensity (MFI) results are pooled from five animals in each group. Data are from one representative experiment of two independent experiments. The error bars represent SEM. *P < 0.05 and **P < 0.01 (one-way ANOVA with post tests); ***P < 0.001 (Student t test).
Fig. 5.
Fig. 5.
PD-1 blockade abrogates the antidiabetic efficacy of IL-7Rα antibody. Anti–PD-1 treatment exacerbates disease in reversal paradigm. Newly diabetic NOD mice were treated with IL-7Rα antibody (A) SB/14 or with (B) 28G9-mIgG2a for a total of three doses once weekly at 10 mg/kg i.p. The treatment period for each IL-7Rα antibody was indicated by the filled and the open bars, respectively. Long-term remission of existing diabetes was observed for over 100 d. The animals reverted to normoglycemia by IL-7Rα antibody were randomly assigned to treatment of either anti–PD-1 (n = 3, or rat IgG2a isotype control (isotype, n = 2–3) once weekly at 200 μg per mouse. Black arrows indicate the timing of anti–PD-1 injections, whereas red arrows indicate that of isotype IgG injection.

Comment in

References

    1. Anderson MS, Bluestone JA. The NOD mouse: A model of immune dysregulation. Annu Rev Immunol. 2005;23:447–485. - PubMed
    1. Castaño L, Eisenbarth GS. Type-I diabetes: A chronic autoimmune disease of human, mouse, and rat. Annu Rev Immunol. 1990;8:647–679. - PubMed
    1. Tisch R, McDevitt H. Insulin-dependent diabetes mellitus. Cell. 1996;85:291–297. - PubMed
    1. Lee LF, et al. The role of TNF-alpha in the pathogenesis of type 1 diabetes in the nonobese diabetic mouse: Analysis of dendritic cell maturation. Proc Natl Acad Sci USA. 2005;102:15995–16000. - PMC - PubMed
    1. Chatenoud L, Bluestone JA. CD3-specific antibodies: A portal to the treatment of autoimmunity. Nat Rev Immunol. 2007;7:622–632. - PubMed

MeSH terms