. 2012 Sep 7;287(37):31298-310.
doi: 10.1074/jbc.M112.366336. Epub 2012 Jun 25.

MicroRNA-153 physiologically inhibits expression of amyloid-β precursor protein in cultured human fetal brain cells and is dysregulated in a subset of Alzheimer disease patients

Affiliations

MicroRNA-153 physiologically inhibits expression of amyloid-β precursor protein in cultured human fetal brain cells and is dysregulated in a subset of Alzheimer disease patients

Justin M Long et al. J Biol Chem. .

Abstract

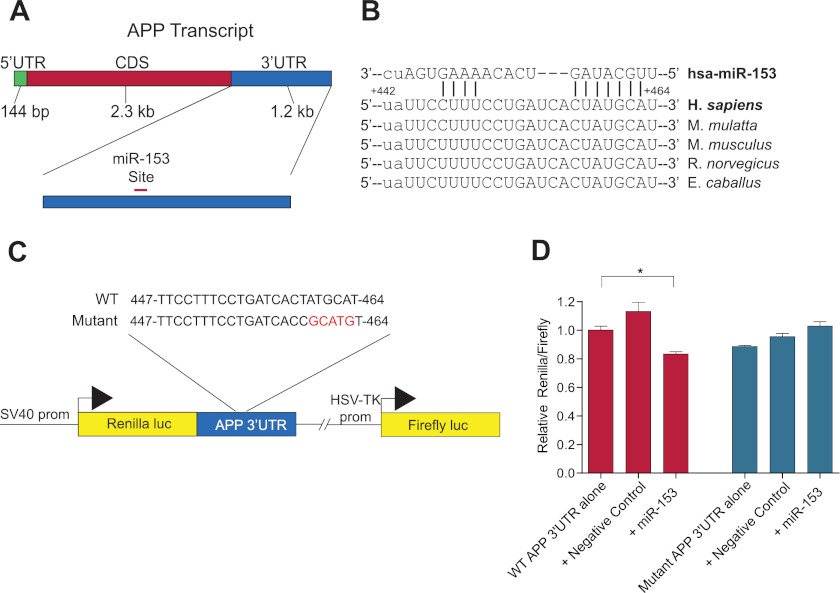
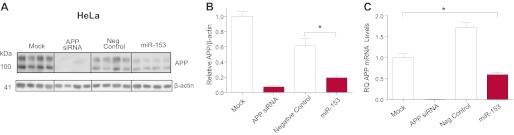
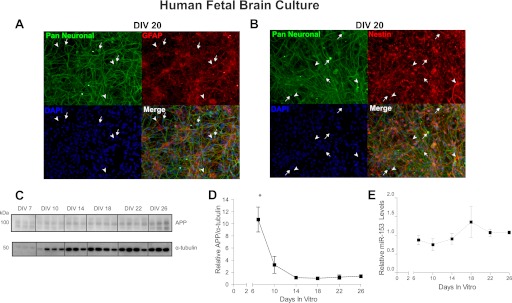
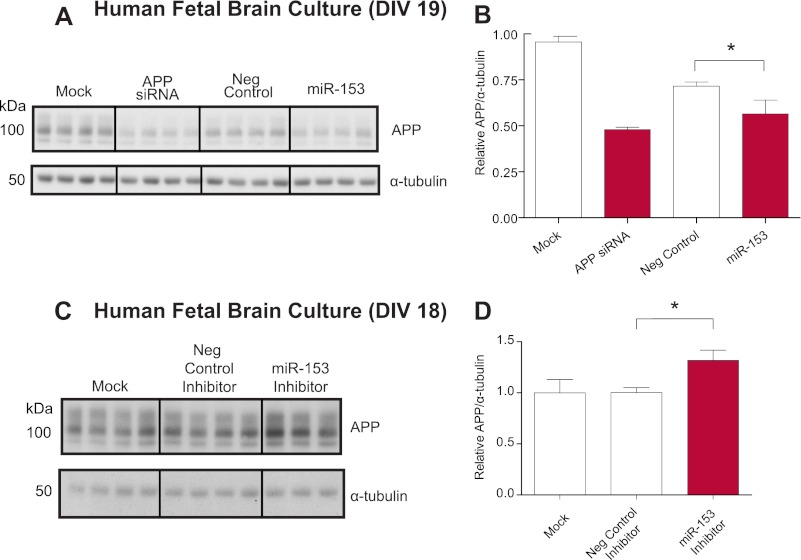
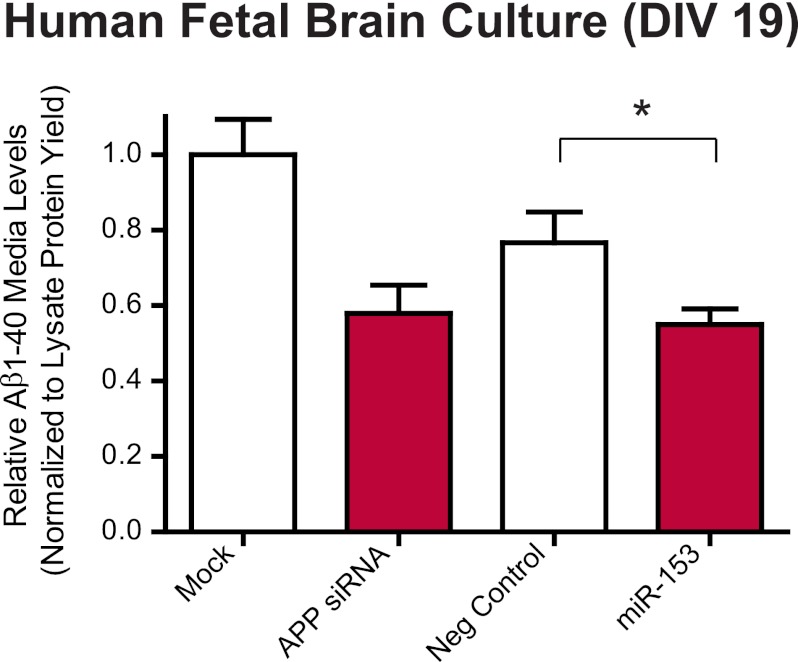
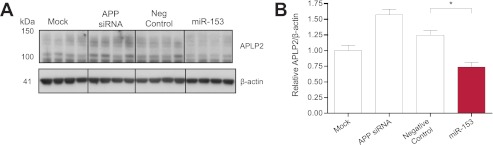
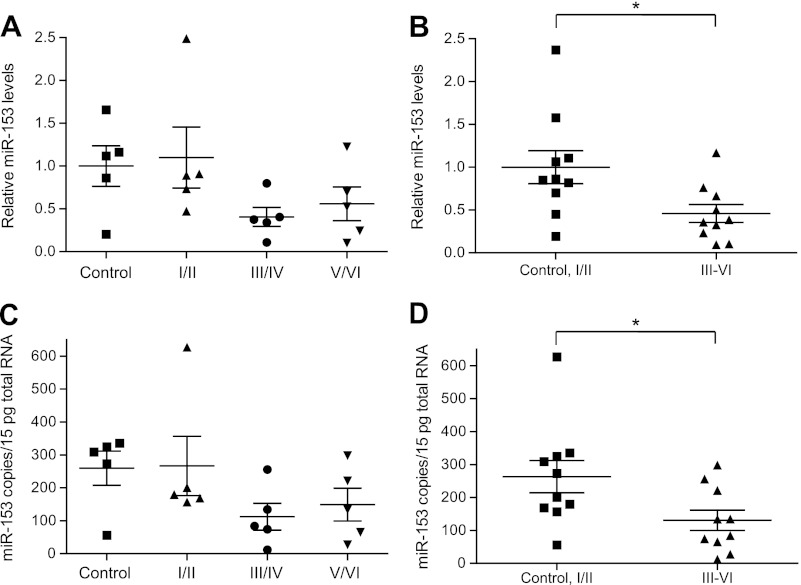
Regulation of amyloid-β (Aβ) precursor protein (APP) expression is complex. MicroRNAs (miRNAs) are expected to participate in the molecular network that controls this process. The composition of this network is, however, still undefined. Elucidating the complement of miRNAs that regulate APP expression should reveal novel drug targets capable of modulating Aβ production in AD. Here, we investigated the contribution of miR-153 to this regulatory network. A miR-153 target site within the APP 3'-untranslated region (3'-UTR) was predicted by several bioinformatic algorithms. We found that miR-153 significantly reduced reporter expression when co-transfected with an APP 3'-UTR reporter construct. Mutation of the predicted miR-153 target site eliminated this reporter response. miR-153 delivery in both HeLa cells and primary human fetal brain cultures significantly reduced APP expression. Delivery of a miR-153 antisense inhibitor to human fetal brain cultures significantly elevated APP expression. miR-153 delivery also reduced expression of the APP paralog APLP2. High functional redundancy between APP and APLP2 suggests that miR-153 may target biological pathways in which they both function. Interestingly, in a subset of human AD brain specimens with moderate AD pathology, miR-153 levels were reduced. This same subset also exhibited elevated APP levels relative to control specimens. Therefore, endogenous miR-153 inhibits expression of APP in human neurons by specifically interacting with the APP 3'-UTR. This regulatory interaction may have relevance to AD etiology, where low miR-153 levels may drive increased APP expression in a subset of AD patients.


Figures

FIGURE 1.
FIGURE 1.
Identification and reporter validation of the putative miR-153 target site in the APP 3′-UTR. A, schematic of the 3.6-kb APP mRNA transcript demonstrating the approximate location of the predicted miR-153 target site in the 3′-UTR. B, sequence and predicted base pairing of human miR-153 with its predicted target site in the human APP 3′-UTR, including the seed sequence interaction (red box). Sequences from rhesus macaque, mouse, rat, and horse from positions orthologous to the predicted miR-153 target site in the human APP 3′-UTR demonstrate strong sequence conservation at this site. C, schematic of the APP 3′-UTR reporter construct containing the APP 3′-UTR located downstream of the Renilla luciferase coding sequence. Firefly luciferase is independently transcribed and serves as an internal control. Both a WT and mutant construct containing a mutated seed sequence in the predicted miR-153 target site (in red) were prepared. D, reporter assay demonstrating functional activity of miR-153 against the APP 3′-UTR and specificity of predicted target site. The WT and mutant APP 3′-UTR reporter constructs were transfected into HeLa cells either alone or in combination with a negative control or miR-153 mimic (40 nm). Renilla and firefly luciferase assays were performed 48 h post-transfection and analyzed as relative ratios of Renilla to firefly luciferase activity. Co-transfection of miR-153 with WT reporter resulted in reduced Renilla luciferase expression relative to reporter alone or negative control (*, p = 0.015 by Tukey's HSD test; n = 6). No inhibitory effect of miR-153 on reporter expression was observed in co-transfections with the mutant reporter construct. Red bars, transfections with the WT reporter construct. Blue bars, transfections with the mutant reporter construct. CDS, coding sequence; luc, luciferase; prom, promoter. Error bars, S.E.
FIGURE 2.
FIGURE 2.
miR-153 inhibits expression of endogenous APP mRNA and protein. HeLa cells were either mock-transfected or transfected with 20 nm APP siRNA, 50 nm negative control, or 50 nm miR-153 mimic. RNA was extracted, and protein cell lysates were prepared 48 and 72 h post-transfection, respectively, as described under “Experimental Procedures.” A, APP and β-actin protein levels were measured by Western blot analysis. B, densitometric analysis of APP normalized to β-actin revealed that miR-153 significantly reduced APP protein levels relative to mock or negative control mimic transfections (*, p = 0.002 by Tukey's HSD test; n = 4). C, APP mRNA levels were significantly decreased following miR-153 transfection as measured by RT-qPCR (*, p = 0.01 by Tukey's HSD test; n = 3). RT-qPCR expression levels were normalized to the geometric mean of β-actin, B2M, GAPDH and TBP expression levels and further scaled relative to mock-transfected levels. RQ, relative quantification. Error bars, S.E.
FIGURE 3.
FIGURE 3.
Time profile of APP and miR-153 levels in an HFB culture. A and B, HFB cultures at DIV20 following continuous bFGF exposure were co-labeled with a pan-neuronal antibody mixture and anti-GFAP (A) or with anti-nestin and anti-GFAP (B). Significant co-labeling with each combination as well as individual labeling with pan-neuronal and anti-GFAP antibodies suggests the presence of immature neural stem cells as well as both differentiated neurons and astrocytes. Arrows point to cells only labeled the pan-neuronal mixture. The arrowheads point to cells only labeled by either anti-GFAP or anti-nestin. C, Western blot analysis of APP and α-tubulin levels across time (DIV 7–26) in a HFB culture. D, densitometric analysis of APP normalized to α-tubulin demonstrated that APP levels rapidly decrease from DIV 7 to 14 and exhibit the lowest expression levels at DIV 18 (*, p < 0.001 versus all time points by Tukey's HSD test). E, RT-qPCR analysis of miR-153 levels across time in the same HFB culture as in B and C. miR-153 expression exhibits an inverse pattern relative to APP, with the highest expression at DIV 18, although there are no statistically significant differences between any of the time points (ANOVA, p = 0.462). Error bars, S.E.
FIGURE 4.
FIGURE 4.
miR-153 endogenously regulates APP expression in HFB cultures. A, Western blot analysis of APP and α-tubulin levels in transfected HFB cultures. HFB cells at DIV 17 were either mock-transfected, transfected with 20 nm APP siRNA, or transfected with 150 nm negative control or miR-153 mimic. Cell lysates were prepared 48 h post-transfection. B, densitometric analysis of APP levels normalized to α-tubulin levels demonstrated that miR-153 significantly reduced APP expression in HFB cells (*, p < 0.05 by Student-Neuman-Keuls test; n = 4). C, Western blot analysis of APP and α-tubulin levels in transfected HFB cultures. HFB cells at DIV 17 were either mock-transfected or transfected with 1000 nm negative control or miR-153 antisense inhibitor. Cell lysates for proteins were prepared 24 h post-transfecton. D, densitometric analysis of APP normalized to α-tubulin demonstrated that miR-153 inhibitor significantly increased APP expression in HFB cells (*, p = 0.018 by post hoc Dunnett's t test; n = 3–4). Error bars, S.E.
FIGURE 5.
FIGURE 5.
miR-153 reduces secretion of Aβ(1–40) into the conditioned media of HFB cultures. HFB cells at DIV 17 were either mock-transfected, transfected with 20 nm APP siRNA, or transfected with 150 nm negative control or miR-153 mimic. Conditioned media were collected 48 h post-transfection. Aβ(1–40) levels were measured in CM by ELISA as described under “Experimental Procedures.” Absolute values (pg/ml) were normalized to the total protein yield of crude cell lysates and scaled relative to mock transfection to account for variability associated with differences in cell number and viability as described under “Experimental Procedures.” Transfection of miR-153 significantly reduced levels of Aβ(1–40) released in the CM of HFB cultures as compared with negative control-transfected cultures (*, p = 0.04 by Student's t test; n = 4). Error bars, S.E.
FIGURE 6.
FIGURE 6.
miR-153 down-regulates expression of APLP2 in primary HFB cultures. A, Western blot analysis of APLP2 and β-actin levels in transfected HFB cultures. HFB cells at DIV 17 were either mock-transfected, transfected with 20 nm APP siRNA, or transfected with 150 nm negative control or miR-153 mimic. Cell lysates were prepared 48 h post-transfection. B, densitometric analysis of APLP2 levels normalized to β-actin levels demonstrated that miR-153 significantly reduced APLP2 expression in HFB cells (*, p < 0.01 by post hoc Tukey's HSD test; n = 4). Error bars, S.E.
FIGURE 7.
FIGURE 7.
APP levels are dysregulated in advanced AD brain specimens. A, Western blot analysis of APP and α-tubulin levels in control (A), early (stage I/II) (B), definite (stage III/IV) (C), and severe (stage V/VI) (D) AD brain specimens. B, densitometric analysis of APP levels normalized to α-tubulin levels demonstrated that APP levels were significantly elevated in definite (Braak stages III/IV) AD specimens (*, p = 0.041 by post hoc Tukey's HSD test; n = 5). C, densitometric analysis also revealed that APP levels were significantly increased in specimens with neocortical NFT pathology (Braak stages III–VI) as compared with specimens lacking neocortical NFT pathology (control and stages I/II) (†, p = 0.048 by Student's t test; n = 10). Error bars, S.E.
FIGURE 8.
FIGURE 8.
miR-153 levels are dysregulated in advanced AD brain specimens. miR-153 levels were quantified by RT-qPCR analysis. In A and B, relative expression levels were normalized to the geometric mean of four endogenous controls: RNU6B, RNU48, RNU49, and miR-16. In C and D, expression levels were quantified in absolute terms as miRNA copy counts/15 pg of total RNA using standard curves prepared from serial dilutions of miRNA oligonucleotide standards with known concentrations. In A and C, expression levels were compared across control and Braak stage I/II, III/IV, and V/VI specimens. In B and D, expression levels were compared across two supergroups either with neocortical NFT pathology (Braak stages III/VI) or without neocortical NFT (control and Braak stages I/II). A, miR-153 levels were lowest in Braak stages III/IV and stages V/VI, but no statistical difference was observed between groups (ANOVA, p = 0.215). B, miR-153 levels were significantly decreased in AD specimens with neocortical NFT (Braak stages III–VI) as compared with specimens lacking neocortical NFT (control, stages I/II) (*, p = 0.024 by Student's t test). C, miR-153 levels were lowest in Braak stages III/IV and stages V/VI, but no statistical difference was observed between groups (ANOVA, p = 0.420). D, as in B, miR-153 levels were significantly decreased in AD specimens with neocortical NFT as compared with specimens without (*, p = 0.035 by Student's t test). Error bars, S.E.

References

    1. Alzheimer's Association, Thies W., Bleiler L. (2011) 2011 Alzheimer's disease facts and figures. Alzheimers Dement. 7, 208–244 - PubMed
    1. Hardy J., Selkoe D. J. (2002) The amyloid hypothesis of Alzheimer's disease. Progress and problems on the road to therapeutics. Science 297, 353–356 - PubMed
    1. Karran E., Mercken M., De Strooper B. (2011) The amyloid cascade hypothesis for Alzheimer's disease. An appraisal for the development of therapeutics. Nat. Rev. Drug Discov. 10, 698–712 - PubMed
    1. Thinakaran G., Koo E. H. (2008) Amyloid precursor protein trafficking, processing, and function. J. Biol. Chem. 283, 29615–29619 - PMC - PubMed
    1. Nelson P. T., Braak H., Markesbery W. R. (2009) Neuropathology and cognitive impairment in Alzheimer disease. A complex but coherent relationship. J. Neuropathol. Exp. Neurol. 68, 1–14 - PMC - PubMed

Publication types

MeSH terms