

Association between visceral adiposity and colorectal polyps on CT colonography
- PMID: 22733893
- PMCID: PMC3412298
- DOI: 10.2214/AJR.11.7842
Association between visceral adiposity and colorectal polyps on CT colonography
Abstract
Objective: The purpose of this article is to determine whether there is an association between visceral adiposity measured on CT colonography (CTC) and colorectal polyps.
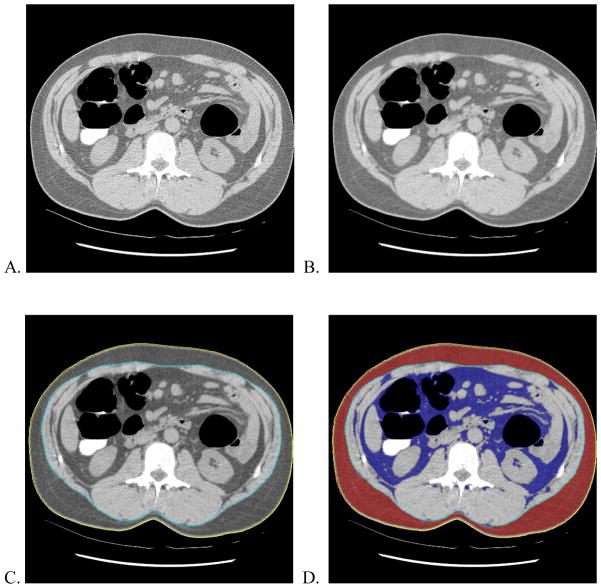
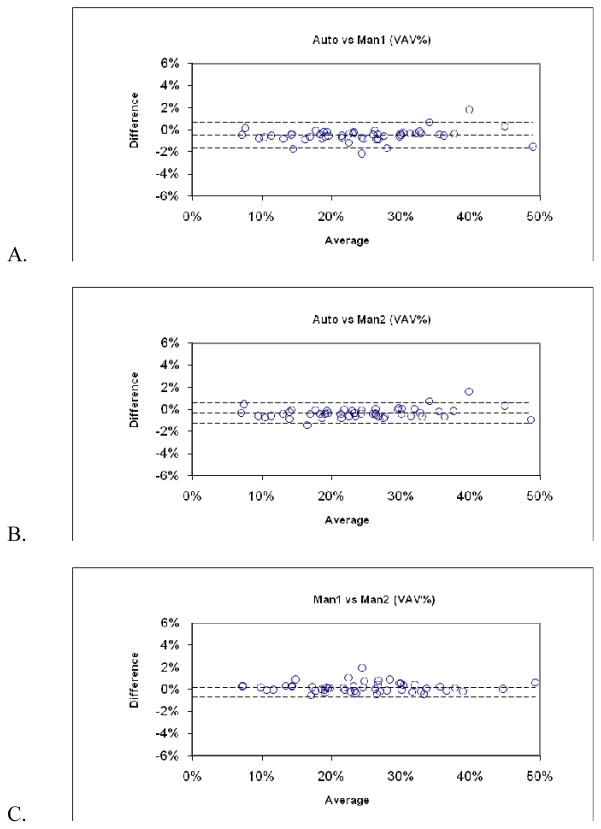
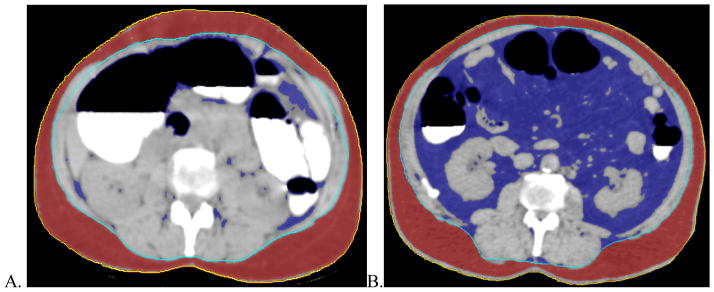
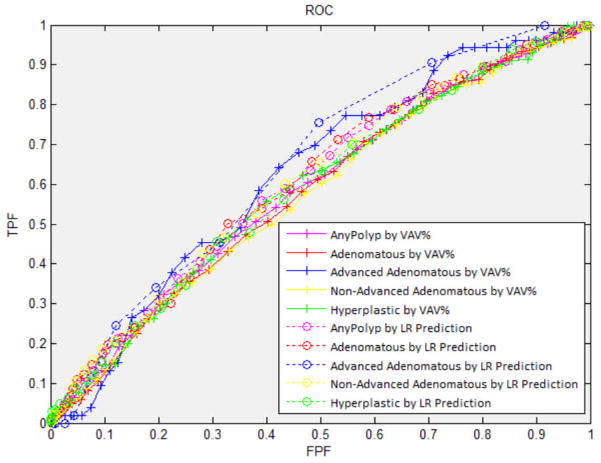
Materials and methods: Patients who underwent CTC and same-day optical colonoscopy (n = 1186) were analyzed. Visceral adipose tissue volumes and volume percentages relative to total internal body volume were measured on slices in the L2-L3 regions on supine CTC scans with validated fully automated software. Student t test, odds ratio, logistic regression, and receiver operating characteristic analyses were performed.
Results: For subjects with (n = 345) and without (n = 841) adenomatous polyps, the mean (± SD) volume percentages were 31.2% ± 10.8% and 28.2% ± 11.3%, respectively (p < 0.0001). For subjects with (n = 244) and without (n = 942) hyperplastic polyps, the volume percentages were 31.8% ± 10.7% and 28.3% ± 11.2%, respectively (p < 0.0001). Comparing the lowest and highest quintiles of volume percentage, the odds ratios for having at least one adenomatous polyp or hyperplastic polyp versus no polyp were 2.06 (95% CI, 1.36-3.13) and 1.71 (95% CI, 1.08-2.71), and the prevalence of having adenomatous polyps or hyperplastic polyps increased by 14% and 8%, respectively.
Conclusion: Subjects with higher visceral adiposity measurements on CTC have a greater risk for the presence of colonic polyps.
Conflict of interest statement
Author Summers and Yao have pending and/or awarded patents for the subject matter described in the manuscript and receive royalty income for a patent license from iCAD. Dr. Summers’ lab is supported in part by a Cooperative Research and Development Agreement with iCAD. Author Pickhardt is on the medical advisory boards of Viatronix, Inc. and Medicsight, Inc., a consultant to Check-Cap and Bracco and co-founder of VirtuoCTC. Author Choi is on the medical advisory boards of Viatronix, Inc and QI and has received research support from E-Z-EM.
Figures
Similar articles
-
Associations among pericolonic fat, visceral fat, and colorectal polyps on CT colonography.Obesity (Silver Spring). 2015 Feb;23(2):408-14. doi: 10.1002/oby.20987. Epub 2014 Dec 31. Obesity (Silver Spring). 2015. PMID: 25558027 Free PMC article.
-
Automated measurement of colorectal polyp height at CT colonography: hyperplastic polyps are flatter than adenomatous polyps.AJR Am J Roentgenol. 2009 Nov;193(5):1305-10. doi: 10.2214/AJR.09.2442. AJR Am J Roentgenol. 2009. PMID: 19843746 Free PMC article.
-
Visceral fat analysis at CT colonography.Acad Radiol. 2006 Aug;13(8):963-8. doi: 10.1016/j.acra.2006.04.008. Acad Radiol. 2006. PMID: 16843848
-
Visceral adiposity and inflammatory bowel disease.Int J Colorectal Dis. 2021 Nov;36(11):2305-2319. doi: 10.1007/s00384-021-03968-w. Epub 2021 Jun 9. Int J Colorectal Dis. 2021. PMID: 34104989 Review.
-
Critical analysis of the performance of double-contrast barium enema for detecting colorectal polyps > or = 6 mm in the era of CT colonography.AJR Am J Roentgenol. 2008 Feb;190(2):374-85. doi: 10.2214/AJR.07.2099. AJR Am J Roentgenol. 2008. PMID: 18212223 Review.
Cited by
-
Relationship between BMI, CT-derived body composition and colorectal neoplasia in a bowel screening population.Scott Med J. 2022 Aug;67(3):93-102. doi: 10.1177/00369330221102237. Epub 2022 May 22. Scott Med J. 2022. PMID: 35603880 Free PMC article.
-
Visceral fat quantification in asymptomatic adults using abdominal CT: is it predictive of future cardiac events?Abdom Imaging. 2015 Jan;40(1):222-6. doi: 10.1007/s00261-014-0192-z. Abdom Imaging. 2015. PMID: 25015400 Free PMC article.
-
Worse cardiometabolic health in African immigrant men than African American men: reconsideration of the healthy immigrant effect.Metab Syndr Relat Disord. 2014 Aug;12(6):347-53. doi: 10.1089/met.2014.0026. Epub 2014 May 9. Metab Syndr Relat Disord. 2014. PMID: 24814168 Free PMC article.
-
Increased risk of colorectal polyps in patients with non-alcoholic fatty liver disease undergoing liver transplant evaluation.J Gastrointest Oncol. 2015 Oct;6(5):459-68. doi: 10.3978/j.issn.2078-6891.2015.050. J Gastrointest Oncol. 2015. PMID: 26487938 Free PMC article.
-
Obesity Increases Prevalence of Colonic Adenomas at Screening Colonoscopy: A Canadian Community-Based Study.Can J Gastroenterol Hepatol. 2017;2017:8750967. doi: 10.1155/2017/8750967. Epub 2017 Jul 11. Can J Gastroenterol Hepatol. 2017. PMID: 28781966 Free PMC article.
References
-
- Jemal A, Siegel R, Xu J, Ward E. Cancer statistics, 2010. CA Cancer J Clin. 2010;60:277–300. - PubMed
-
- Moghaddam AA, Woodward M, Huxley R. Obesity and risk of colorectal cancer: a meta-analysis of 31 studies with 70,000 events. Cancer Epidemiol Biomarkers Prev. 2007;16:2533–2547. - PubMed
-
- Burke CA. Colonic complications of obesity. Gastroenterol Clin North Am. 2010;39:47–55. - PubMed
-
- Hassan C, Pickhardt PJ, Marmo R, Choi JR. Impact of lifestyle factors on colorectal polyp detection in the screening setting. Diseases of the colon and rectum. 2010;53:1328–1333. - PubMed
Publication types
MeSH terms
Grants and funding
LinkOut - more resources
Full Text Sources
Medical
