. 2012 Aug;26(8):1291-303.
doi: 10.1210/me.2012-1002. Epub 2012 Jun 25.

Rapid actions of plasma membrane estrogen receptors regulate motility of mouse embryonic stem cells through a profilin-1/cofilin-1-directed kinase signaling pathway

Affiliations

Rapid actions of plasma membrane estrogen receptors regulate motility of mouse embryonic stem cells through a profilin-1/cofilin-1-directed kinase signaling pathway

Seung Pil Yun et al. Mol Endocrinol. 2012 Aug.

Abstract

Long-term estrogen actions are vital for driving cell growth, but more recent evidence suggests that estrogen mediates more rapid cellular effects. However, the function of estradiol-17β (E(2))-BSA in mouse embryonic stem cells has not been reported. Therefore, we examined the role of E(2)-BSA in mouse embryonic stem cell motility and its related signal pathways. E(2)-BSA (10(-8) m) significantly increased motility after 24 h incubation and increased filamentous (F)-actin expression; these effects were inhibited by the estrogen receptor antagonist ICI 182,780, indicating that E(2)-BSA bound membrane estrogen receptors and initiated a signal. E(2)-BSA increased c-Src and focal adhesion kinase (FAK) phosphorylation, which was attenuated by ICI 182,780. The E(2)-BSA-induced increase in epidermal growth factor receptor (EGFR) phosphorylation was inhibited by Src inhibitor PP2. As a downstream signal molecule, E(2)-BSA activated cdc42 and increased formation of a complex with the neural Wiskott-Aldrich syndrome protein (N-WASP)/cdc42/transducer of cdc42-dependent actin assembly-1 (TOCA-1), which was inhibited by FAK small interfering RNA (siRNA) and EGFR inhibitor AG 1478. In addition, E(2)-BSA increased profilin-1 expression and cofilin-1 phosphorylation, which was blocked by cdc42 siRNA. Subsequently, E(2)-BSA induced an increase in F-actin expression, and cell motility was inhibited by each signal pathway-related siRNA molecule or inhibitors but not by cofilin-1 siRNA. A combined treatment of cofilin-1 siRNA and E(2)-BSA increased F-actin expression and cell motility more than that of E(2)-BSA alone. These data demonstrate that E(2)-BSA stimulated motility by interacting with profilin-1/cofilin-1 and F-actin through FAK- and c-Src/EGFR transactivation-dependent N-WASP/cdc42/TOCA-1 complex.


Figures
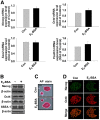
Fig. 1.
Fig. 1.
Effect of E2-BSA on mouse ESC characteristics. A, Cells were treated with E2-BSA (10−8 m) for 24 h. Total RNA from mouse ESC was reverse transcribed, and Nanog, Oct4, Sox2, FoxD3, and β-actin cDNA were amplified by real-time PCR. The example shown is representative of five independent experiments. B, Cells were treated with E2-BSA (10−8 m) for 24 h. Total protein was extracted and blotted with Nanog, Oct4, SSEA-1, and β-actin antibodies. Each example shown is representative of five independent experiments. C and D, AP enzyme activity (C) and immunofluorescence staining with Nanog and Oct4 (D) were assessed in mouse ESC treated in the presence or absence of E2-BSA (10−8 m) for 24 h. Scale bars, 20 μm (magnification, ×400). AP, Alkaline phosphatase; Con, Control.
Fig. 2.
Fig. 2.
Effects of E2-BSA on mouse ESC migration and F-actin expression. A and B, Dose (A) and time (B) response of E2-BSA in a Boyden chamber migration assay. Cells were treated with different doses of E2-BSA (0–10−6 m) for 24 h or with E2-BSA for various times (0–24 h), and cells that had migrated to the lower surface of the filter were enumerated. A minimum of 100 cells were counted per sample. Values represent the mean ± se of five independent experiments with triplicate dishes. *, P < 0.05 vs. control (vehicle, unconjugated BSA). C, In vitro mouse ESC wound-healing motility assay in the absence and presence (10−8 m) of E2-BSA. Ten fields per plate were examined. Scale bars, 100 μm (magnification, ×100). D, Oris cell migration assay. Cells were treated without or with E2-BSA (10−8 m) for 24 h and stained with calcein acetoxymethyl ester (calcein AM) (5 μm). Fluorescence in the analytical zone was quantified with a plate reader. Data represent means ± se of five independent experiments with triplicate dishes. *, P < 0.05 vs. control (vehicle, unconjugated BSA). E and F, Dose (E) and time (F) responses of E2-BSA on F-actin protein expression levels. Cells were treated with E2-BSA (0–10−6 m) for 12 h or for various times (0–24 h) and then harvested. Total protein was extracted and blotted with F-actin antibody. Each example shown is representative of five independent experiments. G, Cells were incubated with 10−8 m E2-BSA for 6 h, and F-actin was detected by staining mouse ESC with Alexa Fluor 488-conjugated phalloidin as a probe for F-actin and then counterstained with propidium iodide. Insets show magnified versions of sections in the white boxes. Scale bars, 20 μm (magnification, ×400). H, Cells were pretreated with the ER antagonist ICI 182,780 (10−6 m) for 30 min before 10−8 m E2-BSA treatment for 6 h. Total protein was extracted and blotted with F-actin or β-actin antibodies. Each example shown is representative of five independent experiments. The lower part (E, F, and H) depicting the bars denotes the mean ± se of five independent experiments for each condition determined from densitometry relative to β-actin. *, P < 0.05 vs. control. Con, Control; ROD, relative OD.
Fig. 3.
Fig. 3.
Involvement of FAK phosphorylation and EGFR transactivation via c-Src. A, Cells were incubated in the presence of E2-BSA (10−8 m) for varying periods of time (0–120 min) and then harvested. Total protein was extracted and blotted with phospho-FAK antibody. B, Cells were pretreated with ICI 182,780 (10−6 m) for 30 min before a 30-min E2-BSA treatment. Total protein was extracted and blotted with phospho-FAK antibody. C, Cells were transfected for 24 h with either FAK siRNA (200 pmol/liter) or nontargeting control siRNA (200 pmol/liter) using Hyperfectamine before the E2-BSA treatment. Total protein was extracted and blotted with F-actin antibody. D, Cells were incubated in the presence of E2-BSA (10−8 m) for various periods of time (0–120 min) and then harvested. Total protein was extracted and blotted with phospho-c-Src antibody. E, Cells were pretreated with ICI 182,780 (10−6 m) for 30 min before a 30-min E2-BSA treatment. Total protein was extracted and blotted with phospho-FAK antibody. F, Cells were incubated in the presence of E2-BSA (10−8 m) for various periods of time (0–120 min) and then harvested. Total protein was extracted and blotted with phospho-EGFR antibody. G, Cells were pretreated with the Src inhibitor PP2 (10−6 m) for 30 min before a 60-min E2-BSA treatment. Total protein was extracted and blotted with phospho-EGFR antibody. H, Cells were pretreated with PP2 or the EGFR-specific inhibitor AG1478 (10−6 m) for 30 min before a 6-h E2-BSA treatment. Total protein was extracted and blotted with F-actin antibody. A–H, Each example shown is representative of five independent experiments. The lower or right part of A–H depicting the bars denotes the mean ± se of five independent experiments for each condition determined by densitometry relative to total FAK, total EGFR, total Src, or β-actin. *, P < 0.05 vs. control (vehicle, unconjugated BSA); **, P < 0.05 vs. E2-BSA alone. Con, Control; ROD, relative OD.
Fig. 4.
Fig. 4.
Involvement of cdc42 activation and formation of the N-WASP/cdc42/TOCA-1 complex. A, E2-BSA (10−8 m) treated or untreated cells were loaded with GTPγS (lane 1) or GDP (lane 2) before affinity precipitation in the presence of 8 μg GST-PBD on glutathione-Sepharose beads. After each binding reaction at 4 C, the proteins bound to the beads were separated by SDS-PAGE and examined for cdc42. B, Cells were transfected for 24 h with either FAK siRNA (200 pmol/liter) or nontargeting control siRNA (200 pmol/liter) using Hyperfectamine before the E2-BSA treatment. Total protein was extracted, and affinity precipitation was performed with cdc42 antibody. C, Cells were pretreated with AG1478 for 30 min before a 1-h E2-BSA treatment. Total protein was extracted, and affinity precipitation was performed with cdc42 antibody. A–C, Each experiment shown is representative of five experiments. D, Immunofluorescence confocal microscopy in combination with in situ PLA, which detects protein-protein complexes, was used to explore interactions between cdc42, N-WASP, and TOCA-1. Each detected complex is represented by a green dot. Nuclei were counterstained with propidium iodide (red). Scale bars, 20 μm (magnification, ×400). E, Cells were incubated in the presence of E2-BSA (10−8 m) for 2 h and then harvested. Cell lysates were analyzed by Western blotting with antibodies to N-WASP and TOCA-1. Anti-cdc42 immunoprecipitation was analyzed by Western blotting with N-WASP and TOCA-1 antibodies. F, Cells were transfected for 24 h with either FAK siRNA (200 pmol/liter) or nontargeting control siRNA (200 pmol/liter) using Hyperfectamine before the E2-BSA treatment. Cell lysates were analyzed by Western blotting with N-WASP and TOCA-1 antibodies. Immunoprecipitation of anti-cdc42 was analyzed by Western blotting with N-WASP and TOCA-1 antibodies. G, Cells were pretreated in the absence and presence of AG1478 (10−6 m) for 30 min before a 2-h E2-BSA treatment. Cell lysates were analyzed by Western blotting with N-WASP and TOCA-1 antibodies. Anti-cdc42 immunoprecipitation was analyzed by Western blotting with N-WASP and TOCA-1 antibodies. H, Cells were transfected for 24 h with N-WASP-, cdc42-, or TOCA-1 siRNA (200 pmol/liter) or nontargeting control siRNA (200 pmol/liter) using Hyperfectamine before the E2-BSA treatment. Total protein was extracted and blotted with F-actin antibody. E–H, Each example is representative of five independent experiments. The right or lower part of A–C and E–H depicting the bars denotes the mean ± se of five independent experiments for each condition determined by densitometry relative to cdc42 or β-actin. *, P < 0.05 vs. control (vehicle, unconjugated BSA), # and **, P < 0.05 vs. E2-BSA alone. Con, Control; ROD, relative OD.
Fig. 5.
Fig. 5.
Effect of E2-BSA on profilin-1 expression and cofilin-1 phosphorylation. A, Cells were incubated in the presence of E2-BSA (10−8 m) for various periods of time (0–24 h) and then harvested. Total protein was extracted and blotted with profilin-1 and phospho-cofilin-1 antibody. B, Cells were transfected for 24 h with either cdc42 siRNA (200 pmol/liter) or nontargeting control siRNA (200 pmol/liter) using Hyperfectamine before the E2-BSA treatment. Total protein was extracted and blotted with profilin-1 antibody. C, Cells were similarly transfected and treated with E2-BSA, and β1-integrin was detected by immunostaining with anti-profilin-1 antibody and phalloidin. Scale bars, 20 μm (magnification, ×400). D, Cells were transfected for 24 h with either cdc42 siRNA (200 pmol/liter) or nontargeting control siRNA (200 pmol/liter) using Hyperfectamine before the E2-BSA treatment. Total protein was extracted and blotted with phospho-cofilin-1 antibody. E, Cells were similarly transfected and treated with E2-BSA, and β1-integrin was detected by immunostaining with anti-phospho-cofilin-1 antibody and phalloidin. Scale bars, 20 μm (magnification, ×400). F, Cells were transfected for 24 h with profilin-1- or cofilin-1 siRNA (200 pmol/liter) or nontargeting control siRNA (200 pmol/liter) using Hyperfectamine before the E2-BSA treatment. Total protein was extracted and blotted with F-actin antibody. In A, B, D, and F, each example is representative of five independent experiments. The lower part of A, B, D, and F depicting the bars denotes the mean ± se of five independent experiments for each condition determined by densitometry relative to cofilin or β-actin. *, P < 0.05 vs. control (vehicle, unconjugated BSA); # and **, P < 0.05 vs. E2-BSA alone. Con, Control; ROD, relative OD.
Fig. 6.
Fig. 6.
Role of E2-BSA and its related signal molecules on mouse embryonic stem cell (ESC) migration. A, Phalloidin staining of the F-actin expression marker. Cells were pretreated with ICI 182,780, FAK siRNA, PP2, AG1478, and N-WASP-, cdc42-, TOCA-1-, profilin-1, and cofilin-1 siRNA for 30 min or 24 h before 10−8 m E2-BSA treatment for 6 h and detected by staining the cells with Alexa Fluor 488-conjugated phalloidin as a probe for F-actin and then counterstained with propidium iodide (PI). Scale bars, 20 μm (magnification, ×400). B, Cells were pretreated with each inhibitor and siRNA for 30 min or 24 h before 10−8 m E2-BSA treatment for 24 h. Cells that had migrated to the lower surface of the filter were counted under the microscope. A minimum of 100 cells were counted per sample. Values represent the mean ± se of five independent experiments with triplicate dishes. *, P < 0.05 vs. control (vehicle, unconjugated BSA); #, P < 0.05 vs. E2-BSA alone. C, Oris cell migration assay. Cells were pretreated with each inhibitor and siRNA for 30 min or 24 h before 10−8 m E2-BSA treatment for 24 h and stained with calcein acetoxymethyl ester (calcein AM) (5 μm). Fluorescence in the analytical zone was quantified with a plate reader. Data represent means ± se of five independent experiments with triplicate dishes. *, P < 0.05 vs. control (vehicle, unconjugated BSA); #, P < 0.05 vs. E2-BSA alone. D, In vitro mouse ESC wound-healing motility assay. Ten fields per plate were examined. Scale bars, 100 μm (magnification, ×100). Con, Control.
Fig. 7.
Fig. 7.
A hypothetical model for the proposed signaling network involved in E2-BSA-induced ESC migration. E2-BSA increases FAK activity as well as EGFR phosphorylation via c-Src. Membrane ER-dependent FAK and EGFR-dependent N-WASP/cdc42/TOCA-1 signaling pathways stimulated profilin-1 expression and cofilin-1 phosphorylation, which increased F-actin expression levels. E2-BSA is estradiol-6-O-carboxymethyloxime-BSA.

Similar articles

Cited by

References

    1. Park JH , Lee MY , Han HJ. 2009. A potential role for caveolin-1 in estradiol-17β-induced proliferation of mouse embryonic stem cells: involvement of Src, PI3K/Akt, and MAPKs pathways. Int J Biochem Cell Biol 41:659–665 - PubMed
    1. Yun SP , Lee MY , Ryu JM , Song CH , Han HJ. 2009. Role of HIF-1α and VEGF in human mesenchymal stem cell proliferation by 17β-estradiol: involvement of PKC, PI3K/Akt, and MAPKs. Am J Physiol Cell Physiol 296:C317–C326 - PubMed
    1. Zhou S , Zilberman Y , Wassermann K , Bain SD , Sadovsky Y , Gazit D. 2001. Estrogen modulates estrogen receptor α and β expression, osteogenic activity, and apoptosis in mesenchymal stem cells (MSCs) of osteoporotic mice. J Cell Biochem Suppl 36:144–155 - PubMed
    1. Björnström L , Sjöberg M. 2005. Mechanisms of estrogen receptor signaling: convergence of genomic and nongenomic actions on target genes. Mol Endocrinol 19:833–842 - PubMed
    1. Keung W , Chan ML , Ho EY , Vanhoutte PM , Man RY. 2011. Non-genomic activation of adenylyl cyclase and protein kinase G by 17β-estradiol in vascular smooth muscle of the rat superior mesenteric artery. Pharmacol Res 64:509–516 - PubMed

Publication types

MeSH terms