

Identifying genetic marker sets associated with phenotypes via an efficient adaptive score test
- PMID: 22734045
- PMCID: PMC3440238
- DOI: 10.1093/biostatistics/kxs015
Identifying genetic marker sets associated with phenotypes via an efficient adaptive score test
Abstract
In recent years, genome-wide association studies (GWAS) and gene-expression profiling have generated a large number of valuable datasets for assessing how genetic variations are related to disease outcomes. With such datasets, it is often of interest to assess the overall effect of a set of genetic markers, assembled based on biological knowledge. Genetic marker-set analyses have been advocated as more reliable and powerful approaches compared with the traditional marginal approaches (Curtis and others, 2005. Pathways to the analysis of microarray data. TRENDS in Biotechnology 23, 429-435; Efroni and others, 2007. Identification of key processes underlying cancer phenotypes using biologic pathway analysis. PLoS One 2, 425). Procedures for testing the overall effect of a marker-set have been actively studied in recent years. For example, score tests derived under an Empirical Bayes (EB) framework (Liu and others, 2007. Semiparametric regression of multidimensional genetic pathway data: least-squares kernel machines and linear mixed models. Biometrics 63, 1079-1088; Liu and others, 2008. Estimation and testing for the effect of a genetic pathway on a disease outcome using logistic kernel machine regression via logistic mixed models. BMC bioinformatics 9, 292-2; Wu and others, 2010. Powerful SNP-set analysis for case-control genome-wide association studies. American Journal of Human Genetics 86, 929) have been proposed as powerful alternatives to the standard Rao score test (Rao, 1948. Large sample tests of statistical hypotheses concerning several parameters with applications to problems of estimation. Mathematical Proceedings of the Cambridge Philosophical Society, 44, 50-57). The advantages of these EB-based tests are most apparent when the markers are correlated, due to the reduction in the degrees of freedom. In this paper, we propose an adaptive score test which up- or down-weights the contributions from each member of the marker-set based on the Z-scores of their effects. Such an adaptive procedure gains power over the existing procedures when the signal is sparse and the correlation among the markers is weak. By combining evidence from both the EB-based score test and the adaptive test, we further construct an omnibus test that attains good power in most settings. The null distributions of the proposed test statistics can be approximated well either via simple perturbation procedures or via distributional approximations. Through extensive simulation studies, we demonstrate that the proposed procedures perform well in finite samples. We apply the tests to a breast cancer genetic study to assess the overall effect of the FGFR2 gene on breast cancer risk.
Figures
 and
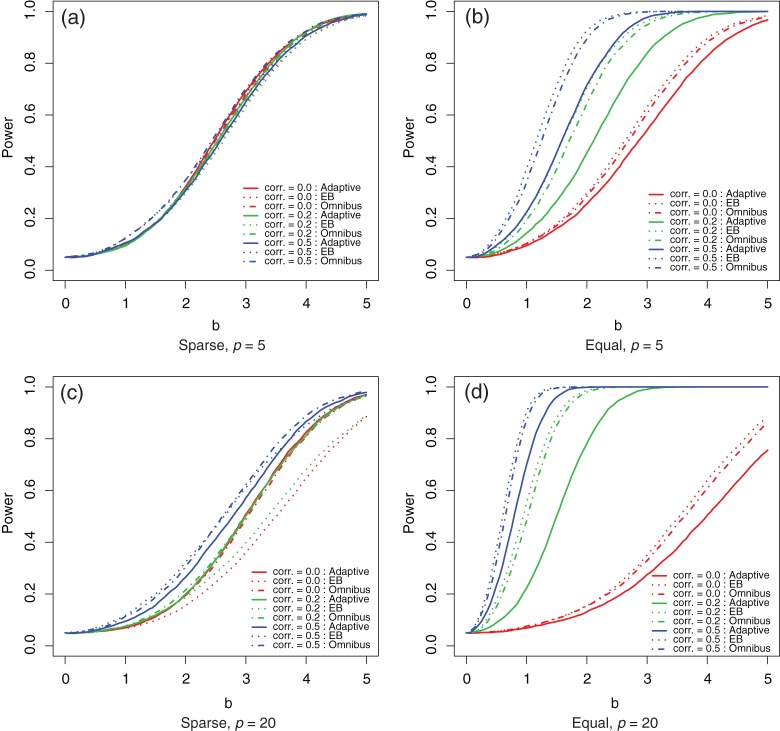
and  (dot dashed curves) tests under local alternatives with various levels of correlations (corr.): 0.0 (thin gray curves); 0.2 (black curves); and 0.5 (thick gray curves).
References
-
- Baum A. E., Akula N., Cabanero M., Cardona I., Corona W., Klemens B., Schulze T. G., Cichon S., Rietschel M., Nöthen M. M. A genome-wide association study implicates diacylglycerol kinase eta (DGKH) and several other genes in the etiology of bipolar disorder. Molecular Psychiatry. 2007;13:197–207. others. - PMC - PubMed
-
- Breslow N. E., Clayton D. G. Approximate inference in generalized linear mixed models. Journal of the American Statistical Association. 1993;88:9–25.
-
- Carlin B. P., Louis T. A. Bayes and empirical Bayes methods for data analysis. Statistics and Computing. 1997;7:153–154.
-
- Commenges D. Robust genetic linkage analysis based on a score test of homogeneity: the weighted pairwise correlation statistic. Genetic Epidemiology. 1994;11:189–200. - PubMed
Publication types
MeSH terms
Substances
Grants and funding
LinkOut - more resources
Full Text Sources
Miscellaneous
