. 2012 Jul 2;209(7):1309-24.
doi: 10.1084/jem.20120239. Epub 2012 Jun 25.

Identification of a genetic locus controlling bacteria-driven colitis and associated cancer through effects on innate inflammation

Affiliations

Identification of a genetic locus controlling bacteria-driven colitis and associated cancer through effects on innate inflammation

Olivier Boulard et al. J Exp Med. .

Abstract

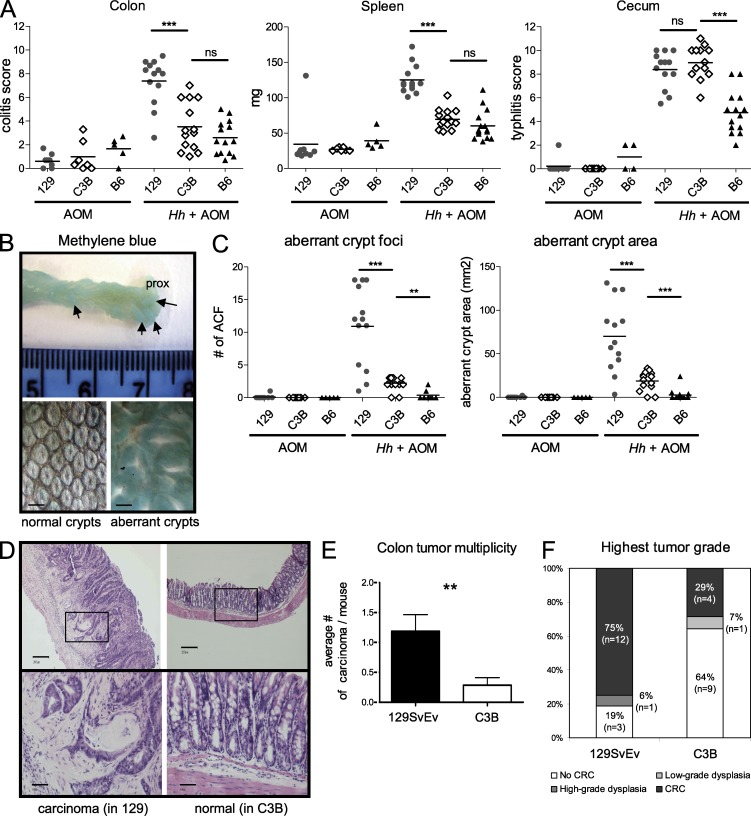
Chronic inflammation of the intestine has been associated with an elevated risk of developing colorectal cancer. Recent association studies have highlighted the role of genetic predisposition in the etiology of colitis and started to unravel its complexity. However, the genetic factors influencing the progression from colon inflammation to tumorigenesis are not known. We report the identification of a genetic interval Hiccs that regulates Helicobacter hepaticus-induced colitis and associated cancer susceptibility in a 129.RAG(-/-) mouse model. The 1.7-Mb congenic interval on chromosome 3, containing eight genes and five microRNAs, renders susceptible mice resistant to colitis and reduces tumor incidence and multiplicity. Bone marrow chimera experiments showed that resistance is conferred by the hematopoietic compartment. Moreover, the Hiccs locus controls the induction of the innate inflammatory response by regulating cytokine expression and granulocyte recruitment by Thy1(+) innate lymphoid cells. Using a tumor-promoting model combining chronic Helicobacter hepaticus infection and the carcinogen azoxymethane, we found that Hiccs also regulates the frequency of colitis-associated neoplasia. Our study highlights the importance of innate immune cells and their genetic configuration in driving progression from inflammation toward cancer and opens the door for analysis of these pathways in human inflammatory disorders and associated cancers.


Figures

Figure 1.
Figure 1.
Dominant protection from colitis and splenomegaly conferred by the B6 chromosome 3 interval. (A) Schematic representation of the interval of B6 origin harbored by the congenic line 129.C3B.RAG on chromosome 3, defined by the microsatellite markers D3Mit103 (107.3 Mb from centromere), D3Mit348/319 (126.7/128.0 Mb), and D3Mit45 (147.8 Mb). (B) Cecum and colon inflammation after H. hepaticus infection of parental B6.RAG and 129.RAG strains or of mice generated by intercrossing of the 129.C3B.RAG congenic line (three possible genotypes for the congenic interval: 129/129, B6/129, or B6/B6). Data represent pooled results from two independent experiments. Horizontal lines represent medians. **, P < 0.01, Mann-Whitney nonparametric test (each group compared with 129.RAG mice). (C) Representative photomicrographs of H&E-stained middle colon sections isolated from H. hepaticus–infected parental B6.RAG, 129.RAG, or mice generated by intercrossing of 129.C3B.RAG congenic line. Bars, 0.2 mm. (D) Splenomegaly was assessed in the same experiments by measuring spleen mass and spleen cell numbers. Horizontal lines represent medians. **, P < 0.01, Mann-Whitney nonparametric test (each group compared with 129.RAG mice).
Figure 2.
Figure 2.
Differential colitis susceptibility between C57BL/6.IL-10−/− and 129S6.IL-10−/− mice. Evaluation of colon inflammation after H. hepaticus infection for 2 mo. Data represent two pooled independent experiments. Three mice of each strain were also analyzed without H. hepaticus infection. Horizontal lines represent medians. **, P < 0.01, Mann-Whitney nonparametric test between B6 and 129 mice.
Figure 3.
Figure 3.
Fine mapping of the Hiccs locus to a 1.71-Mb interval by analysis of subcongenic recombinant lines. (A) Schematic representation of the subcongenic intervals harbored by the respective recombinant lines (compared with the C3B congenic interval). Microsatellite markers used for genotyping are indicated. (B) Evaluation of colon inflammation and splenomegaly after H. hepaticus infection of each recombinant line. Data represent pooled results from five independent experiments. Horizontal lines represent medians. **, P < 0.01, Mann-Whitney nonparametric test (each group compared with R9 recombinant mice). (C) Representative photomicrographs of H&E-stained middle colon sections isolated from H. hepaticus–infected susceptible (R9) or protected (R17 and R12X) mice. Bars, 0.2 mm. (D) Schematic representation of the 1.71-Mb Hiccs interval defined by the recombinant lines R17 and R12X (plain arrow). Phenotype of the recombinant lines is noted as P = protected and S = susceptible. Known genes and microRNAs localized in this interval are indicated (adapted from Ensembl database), as well as markers used for genotyping. Dashed boxes and arrows represent the region containing the recombination point of the indicated line.
Figure 4.
Figure 4.
Cytokine production by LPLs. LPLs were isolated from colons of H. hepaticus–infected recombinant mice. Cytokine production after overnight culture of the LPL was evaluated for susceptible R9 (n = 6, filled bar) and protected (n = 5, open bar) R17 mice. Graphs represent mean ± SEM for each indicated cytokine and show a representative experiment out of two independently performed. *, P < 0.05; **, P < 0.01, Mann-Whitney nonparametric test.
Figure 5.
Figure 5.
Colon mRNA expression levels of the candidate genes in susceptible (R9) and protected (R17) mice. RNA samples were prepared from colons of uninfected or H. hepaticus–infected susceptible (R9, open circles) or protected (R17, filled diamonds) mice. A representative experiment out of at least two independently performed is shown. Level of expression of each candidate gene was assessed by Q-PCR and calculated relative to expression of Hprt. Horizontal lines represent medians. **, P < 0.01, Mann-Whitney nonparametric test.
Figure 6.
Figure 6.
The hematopoietic compartment genotype determines protection and susceptibility to H. hepaticus–induced colitis. (A and B) Reciprocal BM chimeras: spleen mass and histological evaluation of colon inflammation after H. hepaticus infection for 8 wk, comparing control and chimeric groups. BM donors and recipients are indicated on the X axis, as donor→recipient: (A) 129 = susceptible 129.RAG mice, C3B = protected 129.C3B.RAG mice; (B) R9 = susceptible R9 mice, R17 = protected R17 mice. Horizontal lines represent medians. **, P < 0.01, Mann-Whitney nonparametric test. (C) Expression of candidate genes within the hematopoietic compartment. Pooled colon LPL from H. hepaticus–infected protected or susceptible mice were FACS sorted into CD45+ and CD45 populations. The expression level of the candidate genes was analyzed using Q-PCR, normalized to Hprt mRNA, and is indicated relative to CD45 protected samples. Mean ± SD of triplicates from a representative experiment out of two independently performed is shown. (D) BMDMs from susceptible R9 and protected R17 mice were generated and stimulated for 20 h with 1 µg/ml LPS or live H. hepaticus (20 MOI). Candidate gene expression levels were analyzed as described and are shown relative to R9 unstimulated cells. Graphs represent mean ± SEM of two pooled independent experiments (n = 4). *, P < 0.05, Mann-Whitney nonparametric test.
Figure 7.
Figure 7.
The Hiccs locus controls the early inflammatory response through ILCs. (A–D) Time course of early H. hepaticus infection in susceptible 129.RAG (gray circles) and protected R17 (open diamonds) mice. (A) Spleen weight and total colonic LPL count. (B) Frequencies and absolute numbers of granulocytes (CD11bhi Gr1hi), DC (CD11chi CD11b+/−), and monocytes/macrophages (CD11bhi Gr1−/int CD11c) in colon LPL. For ILC (lin neg, Thy1hi, Sca1hi), absolute numbers are shown. For each time point and genotype, the mean and SEM of five to seven mice pooled from two independent experiments are shown. (C) Representative FACS plot of 129.RAG and R17 colonic LPL, showing granulocyte gate (CD11bhi Gr1hi) and frequency. (D) TNF, IL-1β, IFN-γ, IL-17A, and IL-22 were detected by FlowCytomix in the supernatants of overnight cultured LPL. Each dot represents the mean and SEM of two pools with two mice each. IL-23p19 mRNA expression was analyzed by Q-PCR of RNA isolated from fresh LPL. Each dot represents the mean and SEM of two to four mice. One representative experiment out of two with similar results is shown. (E and F) 129.RAG and R17 mice were treated with isotype control or anti-Thy1 antibody to deplete ILC at days 6 and 0 before H. hepaticus infection. Mice were analyzed at day 6 after infection. One of two independent experiments with similar results is shown. (E) Total LPL number, granulocyte frequency, and absolute number. Horizontal lines represent means. (F) TNF, IL-1β, and IFN-γ were detected by FlowCytomix in the supernatants of overnight cultured LPL. Mean and SEM are shown for three mice per condition. **, P < 0.01; *, P < 0.05, Mann-Whitney nonparametric test for A, B, and E, unpaired Student’s t test for F.
Figure 8.
Figure 8.
The B6 congenic interval confers a lower frequency of colorectal cancer. 129 (pooled 129.RAG and R9 mice), C3B (pooled 129.C3B.RAG and R17 mice), or B6 (B6.RAG) groups were infected with H. hepaticus and injected 6 wk later with AOM (one time per week) for 5 wk. Colons were analyzed for tumor formation 5 mo after H. hepaticus infection. (A) Evaluation of colitis, typhlitis, and spleen weight in mice treated with AOM alone or with H. hepaticus + AOM for 5 mo. Data shown are pooled results from two independent experiments. Horizontal lines represent medians. ***, P < 0.001, Mann-Whitney non-parametric test. (B) Changes in crypt structure were analyzed by methylene blue staining. Top picture: characteristic formation of inflammatory lesions in the colon of an Hh+AOM-treated 129.RAG mouse. Microscopic examination revealed the formation of aberrant crypts (bottom right) compared with the structure of normal crypts in an Hh+AOM treated C3B mouse (bottom left). Bars, 0.4 mm. (C) Methylene blue–stained colons were assessed for aberrant crypt foci. Number of foci and area are shown from two pooled independent experiments. Horizontal lines represent medians. ***, P < 0.001, Mann-Whitney nonparametric test. (D–F) Histological evaluation of complete sequential sections of colon from 129 and C3B mice for dysplasia and carcinoma (pooled results from three independent experiments). (D) Photomicrograph of an invasive carcinoma with dysplasia in a 129.RAG mouse (left) compared with the normal histological appearance of a C3B mouse (right). Top bars, 0.2 mm; bottom bars, 0.05 mm. (E) Tumor multiplicity: number of invasive adenocarcinomas per mouse in each group (n = 14 and 16). Graphs represent mean ± SEM. **, P = 0.0086, Mann-Whitney nonparametric test. (F) Tumor incidence: percentage of mice with the indicated tumor grade (highest tumor grade found) within each group.

References

    1. Ahmadi A., Polyak S., Draganov P.V. 2009. Colorectal cancer surveillance in inflammatory bowel disease: the search continues. World J. Gastroenterol. 15:61–66 10.3748/wjg.15.61 - DOI - PMC - PubMed
    1. Anderson C.A., Boucher G., Lees C.W., Franke A., D’Amato M., Taylor K.D., Lee J.C., Goyette P., Imielinski M., Latiano A., et al. 2011. Meta-analysis identifies 29 additional ulcerative colitis risk loci, increasing the number of confirmed associations to 47. Nat. Genet. 43:246–252 10.1038/ng.764 - DOI - PMC - PubMed
    1. Asquith M.J., Boulard O., Powrie F., Maloy K.J. 2010. Pathogenic and protective roles of MyD88 in leukocytes and epithelial cells in mouse models of inflammatory bowel disease. Gastroenterology. 139:519–529: 529: e1–e2 10.1053/j.gastro.2010.04.045 - DOI - PMC - PubMed
    1. Balkwill F., Coussens L.M. 2004. Cancer: an inflammatory link. Nature. 431:405–406 10.1038/431405a - DOI - PubMed
    1. Balkwill F., Mantovani A. 2010. Cancer and inflammation: implications for pharmacology and therapeutics. Clin. Pharmacol. Ther. 87:401–406 10.1038/clpt.2009.312 - DOI - PubMed

Publication types

MeSH terms