. 2012 Jul;29(6):653-64.
doi: 10.3109/07420528.2012.679330.

Fibroblast circadian rhythms of PER2 expression depend on membrane potential and intracellular calcium

Affiliations

Fibroblast circadian rhythms of PER2 expression depend on membrane potential and intracellular calcium

Takako Noguchi et al. Chronobiol Int. 2012 Jul.

Abstract

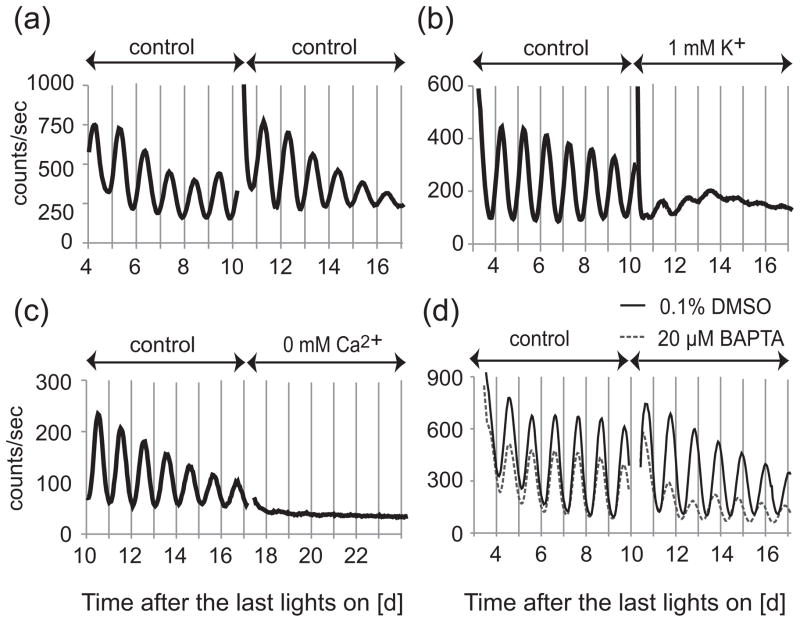
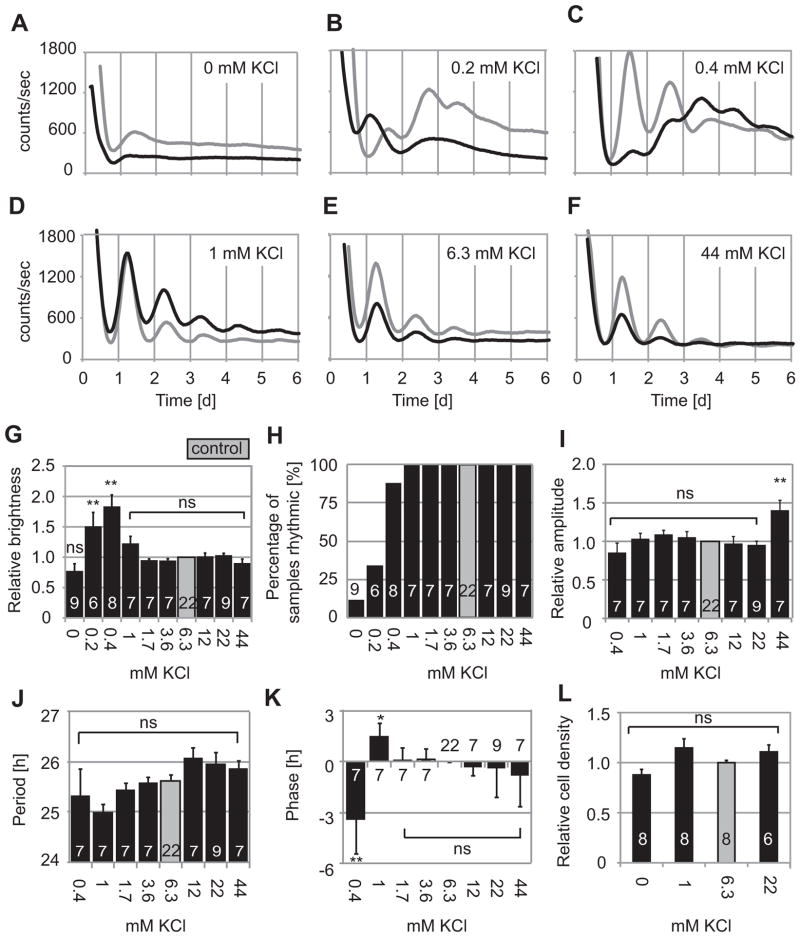
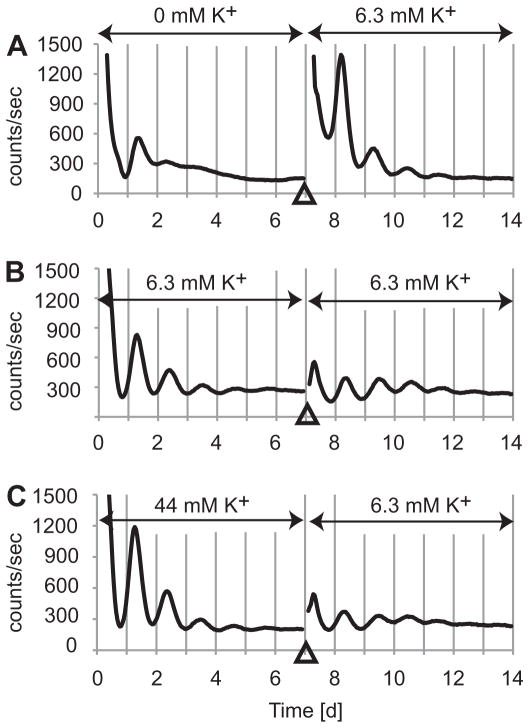
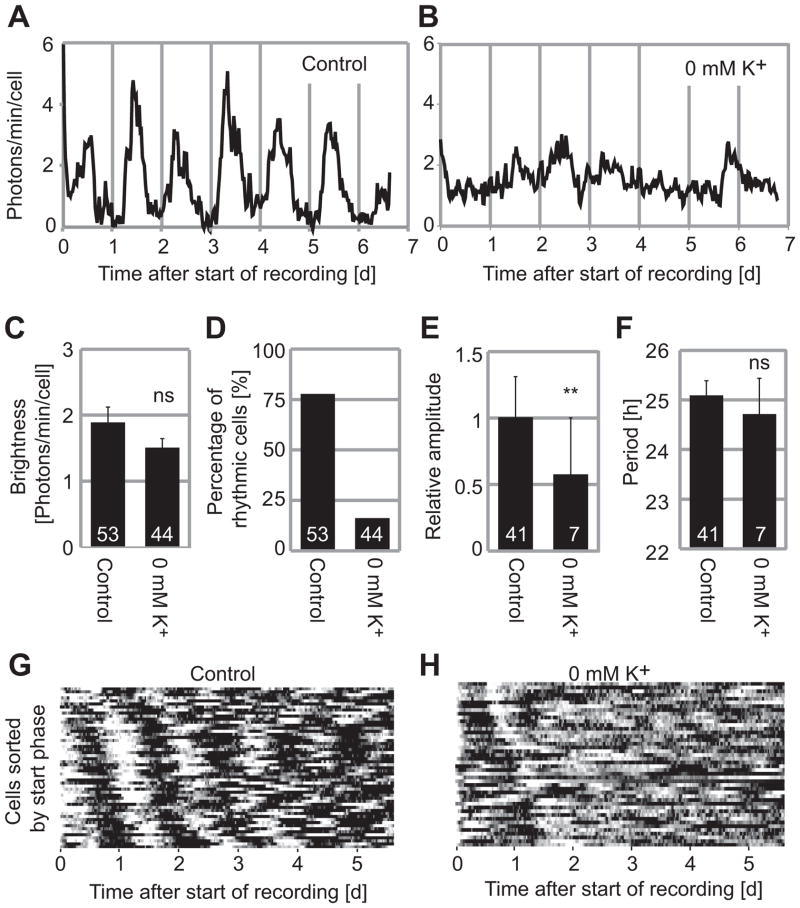
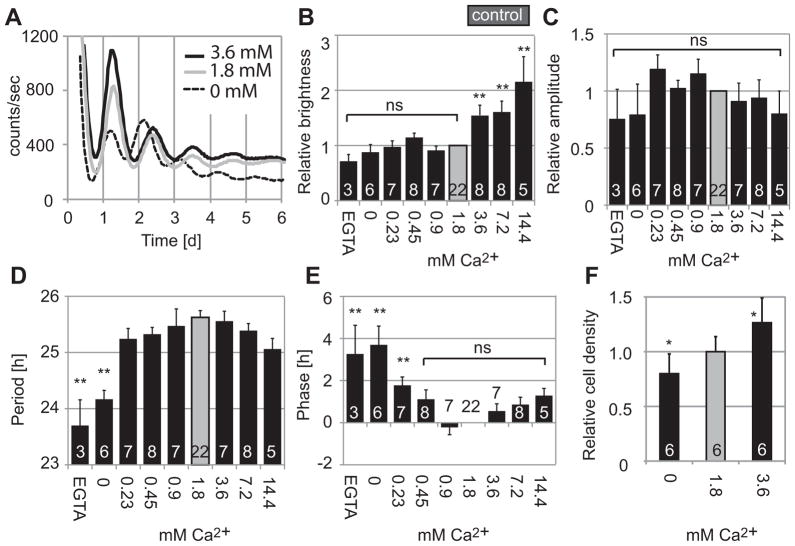
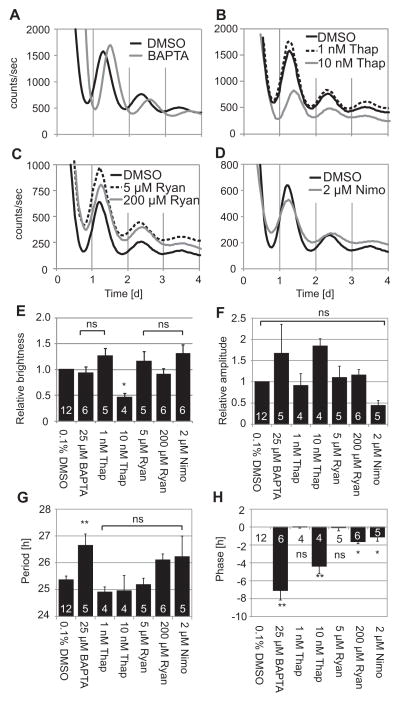
The suprachiasmatic nucleus (SCN) of the hypothalamus synchronizes circadian rhythms of cells and tissues throughout the body. In SCN neurons, rhythms of clock gene expression are suppressed by manipulations that hyperpolarize the plasma membrane or lower intracellular Ca(2+). However, whether clocks in other cells also depend on membrane potential and calcium is unknown. In this study, the authors investigate the effects of membrane potential and intracellular calcium on circadian rhythms in mouse primary fibroblasts. Rhythms of clock gene expression were monitored using a PER2::LUC knockin reporter. Rhythms were lost or delayed at lower (hyperpolarizing) K(+) concentrations. Bioluminescence imaging revealed that this loss of rhythmicity in cultures was due to loss of rhythmicity of single cells rather than loss of synchrony among cells. In lower Ca(2+) concentrations, rhythms were advanced or had shorter periods. Buffering intracellular Ca(2+) by the calcium chelator 1,2-Bis(2-aminophenoxy)ethane-N,N,N',N'-tetraacetic acid tetrakis acetoxymethyl ester (BAPTA-AM) or manipulation of inositol triphosphate (IP(3))-sensitive intracellular calcium stores by thapsigargin delayed rhythms. These results suggest that the circadian clock in fibroblasts, as in SCN neurons, is regulated by membrane potential and Ca(2+). Changes in intracellular Ca(2+) may mediate the effects of membrane potential observed in this study.


Conflict of interest statement

Declaration of Interest: The authors report no conflicts of interest. The authors alone are responsible for the content and writing of the paper.

Figures

Figure 1
Figure 1
Representative recordings of PER2::LUC bioluminescence from SCN slices cultured in control medium, low K+, low Ca2+, or Ca2+ chelator. SCN slices were cultured in HMM control medium for 1–2 weeks and then transferred to fresh HMM control medium (A), or medium with 1 mM K+ (B), 1 mM Ca2+ (C), or 40 μM BAPTA-AM (D). In the case of BAPTA-AM (dissolved in 0.1% DMSO), control medium also contains 0.1% DMSO.
Figure 2
Figure 2
Rhythms of fibroblasts cultured in various K+ concentrations. Two representative PER2::LUC bioluminescence recordings are shown of fibroblast cultures in HMM with 0 (A), 0.2 (B), 0.4 (C), 1 (D), 6.3 (E), or 44 (F) mM K+. Fibroblasts showed clear circadian rhythms in 1–44 mM K+ (D – F), but generally showed poor or no rhythms in 0–0.2 mM K+ (A – C). Data represented by black lines were collected simultaneously in parallel experiments. (G) Brightness relative to 6.3 mM K+ control (gray). (H) Percentage of samples in each condition judged rhythmic by spectral analysis. Amplitudes (I), periods (J), and phases (K) relative to control, for samples categorized as rhythmic. (L) Cell density relative to control cultures. Columns show average values ± SE. Number of cultures in each condition are indicated by white numerals within columns. ns, not significant; *p < 0.05, **p < 0.01 compared to control (ANOVA followed by Dunnett’s test).
Figure 3
Figure 3
Fibroblasts recovered clear circadian rhythmicity after medium change to HMM control. Medium was changed from 0 mM (A), 6.3 mM (B), or 44 mM (C) K+ to 6.3 mM K+ control at 7th day in culture. X-axis shows time after medium change. Y-axis shows relative bioluminescence intensity [counts/sec].
Figure 4
Figure 4
Fibroblasts in 0 mM K+ lose rhythmicity at the single cell level. Fibroblasts were cultured in control medium (A) and in 0 mM K+ (B) for 7 d. X-axis shows time after start of recording and Y-axis show photons/min/cell. (C) Average brightness of single cells. Brightness was not significantly different in 0 mM K+ compared to control (Student’s t-test, ns; p > 0.05). (D) Percentage of single cells in each condition judged rhythmic by spectral analysis. (E) Amplitudes of rhythmic cells, relative to control (Student’s t-test, **; p < 0.01). (F) Periods of rhythmic cells. There was no significant difference from control (Student’s t-test, p > 0.05). Columns show average values ± SE. Numbers of cells in each condition are indicated by white numerals within columns. Bioluminescence rhythms of all 53 fibroblasts from 5 experiments (G) and 44 fibroblasts from 3 experiments (H) are represented in raster plots. Each horizontal raster line represents a single cell, with elapsed time plotted left to right. Bioluminescence intensity data from all cells were normalized for average brightness and then color-coded: higher than average values are white, and lower than average values are black. The cells are sorted in order of start phase, so that emergence of desynchrony can be more easily appreciated.
Figure 5
Figure 5
Representative recordings of PER2::LUC bioluminescence from fibroblast cultures in various Ca2+ concentrations (A). Fibroblasts were cultured in HMM with 0 (dashed line), 1.8 (control, gray line), or 3.6 mM Ca2+ (black line). Fibroblasts showed clear circadian rhythms in all cases. (B) Brightness relative to 1.8 mM Ca2+ control. Amplitudes relative to control (C), periods (D), and phases (E) of samples categorized as rhythmic. Fibroblasts were increased in number in HMM with 3.6 mM Ca2+ and decreased in 0 mM Ca2+ (F). Columns show average values ± SE. Numbers of cultures are indicated by white numerals within columns. ns, not significant; *p < 0.05, **p < 0.01 compared to control (ANOVA followed by Dunnett’s test).
Figure 6
Figure 6
(A – D) Representative recordings of PER2::LUC bioluminescence from fibroblasts cultured in various Ca2+ modulators. Fibroblasts were cultured in control HMM with 0.1% DMSO, 25 μM BAPTA-AM (A), 1 or 10 nM thapsigargin (B), 5 or 200 μM ryanodine (C), or 2 μM nimodipine (D). Fibroblasts showed clear circadian rhythms in all cases, except for one sample in 1 nM Thapsigargin and one sample in 2 μM nimodipine. Data in the same panels were collected simultaneously in parallel experiments. Column plots show brightness (E), rhythm amplitude (F), period (G), and phase (H) relative to control HMM. Bars show average values ± SE. Numbers of samples are indicated by white numerals within columns. ns, not significant; *p < 0.05, **p < 0.01 compared to control (ANOVA followed by Dunnett’s test). BAPTA; BAPTA-AM, Thap: thapsigargin, Ryan; ryanodine, Nimo; nimodipine.

Similar articles

Cited by

References

    1. Baxter DF, Kirk M, Garcia AF, Raimondi A, Holmqvist MH, Flint KK, Bojanic D, Distefano PS, Curtis R, Xie Y. A novel membrane potential-sensitive fluorescent dye improves cell-based assays for ion channels. J Biomol Screen. 2002;7:79–85. - PubMed
    1. Bouskila Y, Dudek FE. A rapidly activating type of outward rectifier K+ current and A-current in rat suprachiasmatic nucleus neurones. J Physiol. 1995;488(Pt 2):339–350. - PMC - PubMed
    1. Chilton L, Ohya S, Freed D, George E, Drobic V, Shibukawa Y, Maccannell KA, Imaizumi Y, Clark RB, Dixon IM, Giles WR. K+ currents regulate the resting membrane potential, proliferation, and contractile responses in ventricular fibroblasts and myofibroblasts. Am J Physiol Heart Circ Physiol. 2005;288:H2931–2939. - PubMed
    1. Cohen JE, Fields RD. CaMKII inactivation by extracellular Ca(2+) depletion in dorsal root ganglion neurons. Cell Calcium. 2006;39:445–454. - PMC - PubMed
    1. Colwell CS. Linking neural activity and molecular oscillations in the SCN. Nat Rev Neurosci. 2011;12:553–569. - PMC - PubMed

Publication types

MeSH terms

LinkOut - more resources