. 2012 Jun;17(6):066011.
doi: 10.1117/1.JBO.17.6.066011.

Quantitative photoacoustic microscopy of optical absorption coefficients from acoustic spectra in the optical diffusive regime

Affiliations

Quantitative photoacoustic microscopy of optical absorption coefficients from acoustic spectra in the optical diffusive regime

Zijian Guo et al. J Biomed Opt. 2012 Jun.

Abstract

Photoacoustic (PA) microscopy (PAM) can image optical absorption contrast with ultrasonic spatial resolution in the optical diffusive regime. Conventionally, accurate quantification in PAM requires knowledge of the optical fluence attenuation, acoustic pressure attenuation, and detection bandwidth. We circumvent this requirement by quantifying the optical absorption coefficients from the acoustic spectra of PA signals acquired at multiple optical wavelengths. With the acoustic spectral method, the absorption coefficients of an oxygenated bovine blood phantom at 560, 565, 570, and 575 nm were quantified with errors of <3%. We also quantified the total hemoglobin concentration and hemoglobin oxygen saturation in a live mouse. Compared with the conventional amplitude method, the acoustic spectral method provides greater quantification accuracy in the optical diffusive regime. The limitations of the acoustic spectral method was also discussed.


Figures

Fig. 1
Fig. 1
Schematic of the AR-PAM system and phantom experiment setups. (a) The schematic of the AR-PAM system. A dye laser pumped by a Nd:YLF laser was the irradiation source. The laser beam from the dye laser was delivered through an optical fiber and passes through a conical lens to provide a ring-shaped area of illumination. A focused ultrasonic transducer was employed to detect PA waves. (b) Use AR-PAM to image a blood-filled tube inserted 1.5 mm deep in the optical scattering medium. The fluence decay profile in the blood is modeled.
Fig. 2
Fig. 2
Quantification of the optical absorption coefficients and hemoglobin concentrations of oxygenated bovine blood phantom. (a) PA time domain A-scan signals of the oxygenated-bovine-blood-filled tube phantom buried in the scattering medium. (b) Acoustic spectra of the PA A-scan signals. (c) Comparison of the optical absorption coefficients quantified with the acoustic spectral method and measured by spectrophotometry. (d) Relative incident fluence quantified with the acoustic spectral method. (e) Comparison of the relative optical absorption coefficients quantified from the PA signal amplitudes with and without the fluence compensation and measured by spectrophotometry. (f) Comparison of the [HbO2] and [HbR] quantified with the acoustic spectral method and spectrophotometry. Amp.: the amplitude method with and without the fluence compensation. Abs.-fitting: the absorption-fitting algorithm. Conc.-fitting: the concentration-fitting algorithm.
Fig. 3
Fig. 3
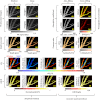
Quantification of the sO2 and [HbT] of blood vessels in the back of a nude mouse in vivo. MAP image acquired at (a) 571 nm and (b) 564 nm. (c) Depth-encoded image of blood vessels. (d) Control images of sO2 and (e) [HbT]. MAP image acquired with an optical phantom layer at (f) 571 nm and (g) 564 nm. (h) Depth-encoded image of blood vessels below the optical phantom layer. (i) sO2 and (j) [HbT] quantified from the amplitude method. Absolute optical absorption coefficients at (k) 571 nm and (l) 564 nm and (m) relative incident fluence quantified with the absorption-fitting algorithm. (n) sO2 and (o) [HbT] quantified from the absolute optical absorption coefficients. (p) [HbO2], (q) [HbR], and (r) relative incident fluence quantified with the concentration-fitting algorithm. (s) sO2 and (t) [HbT] quantified from [HbO2] and [HbR]. (u) sO2 and (v) [HbT] quantified from amplitude method with the fluence compensation. Ctrl.: the control image. Amp.: the amplitude method with and without the fluence compensation. A.S.: the acoustic spectral method. Abs.-fitting: the absorption-fitting algorithm. Conc.-fitting: the concentration-fitting algorithm.
Fig. 4
Fig. 4
Comparison of the Monte Carlo simulation result and the analytical solution.

References

    1. Zhang H. F., et al. , “Imaging of hemoglobin oxygen saturation variations in single vessels in vivo using photoacoustic microscopy,” Appl. Phys. Lett. 90(5), 053901 (2007).APPLAB10.1063/1.2435697 - DOI
    1. Wang L. V., Wu H., Biomedical Optics: Principles and Imaging, Wiley, Hoboken, NJ: (2007).
    1. Chance B., et al. , “Optical and nuclear-magnetic-resonance studies of hypoxia in human tissue and tumors,” Ann. NY Acad. Sci. 551(3), 1–16 (1988).ANYAA910.1111/nyas.1988.551.issue-1 - DOI - PubMed
    1. Maslov K., et al. , “Optical-resolution photoacoustic microscopy for in vivo imaging of single capillaries,” Opt. Lett. 33(9), 929–931 (2008).OPLEDP10.1364/OL.33.000929 - DOI - PubMed
    1. Bouchard L. S., et al. , “Picomolar sensitivity MRI and photoacoustic imaging of cobalt nanoparticles,” Proc. Natl. Acad. Sci. USA 106(11), 4085–4089 (2009).10.1073/pnas.0813019106 - DOI - PMC - PubMed

Publication types