The healthy options for nutrition environments in schools (Healthy ONES) group randomized trial: using implementation models to change nutrition policy and environments in low income schools
- PMID: 22734945
- PMCID: PMC3464788
- DOI: 10.1186/1479-5868-9-80
The healthy options for nutrition environments in schools (Healthy ONES) group randomized trial: using implementation models to change nutrition policy and environments in low income schools
Abstract
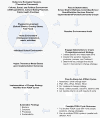
Background: The Healthy Options for Nutrition Environments in Schools (Healthy ONES) study was an evidence-based public health (EBPH) randomized group trial that adapted the Institute for Healthcare Improvement's (IHI) rapid improvement process model to implement school nutrition policy and environmental change.
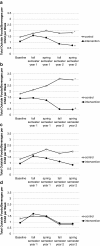
Methods: A low-income school district volunteered for participation in the study. All schools in the district agreed to participate (elementary = 6, middle school = 2) and were randomly assigned within school type to intervention (n = 4) and control (n =4) conditions following a baseline environmental audit year. Intervention goals were to 1) eliminate unhealthy foods and beverages on campus, 2) develop nutrition services as the main source on campus for healthful eating (HE), and 3) promote school staff modeling of HE. Schools were followed across a baseline year and two intervention years. Longitudinal assessment of height and weight was conducted with second, third, and sixth grade children. Behavioral observation of the nutrition environment was used to index the amount of outside foods and beverages on campuses. Observations were made monthly in each targeted school environment and findings were presented as items per child per week.
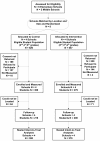
Results: From an eligible 827 second, third, and sixth grade students, baseline height and weight were collected for 444 second and third grade and 135 sixth grade students (51% reach). Data were available for 73% of these enrolled students at the end of three years. Intervention school outside food and beverage items per child per week decreased over time and control school outside food and beverage items increased over time. The effects were especially pronounced for unhealthy foods and beverage items. Changes in rates of obesity for intervention school (28% baseline, 27% year 1, 30% year 2) were similar to those seen for control school (22% baseline, 22% year 1, 25% year 2) children.
Conclusions: Healthy ONES adaptation of IHI's rapid improvement process provided a promising model for implementing nutrition policy and environmental changes that can be used in a variety of school settings. This approach may be especially effective in assisting schools to implement the current federally-mandated wellness policies.
Figures


References
-
- Resnicow K. School-based obesity prevention. Population versus high-risk interventions. Ann N Y Acad Sci. 1993;699:154–166. - PubMed
-
- Wechsler H, McKenna ML, Lee SM, Dietz WH. The role of schools in preventing childhood obesity. The State Educ Stand. 2004;5:4–12.
-
- Dobbins M, De Corby K, Robeson P, Husson H, Tirilis D. School-based physical activity programs for promoting physical activity and fitness in children and adolescents aged 6–18. Cochrane Database Syst Rev. 2009. p. CD007651. http://www.ncbi.nlm.nih.gov/pubmed/19160341. - PubMed
-
- Gonzalez-Suarez C, Worley A, Grimmer-Somers K, Dones V. School-based interventions on childhood obesity: a meta-analysis. Am J Prev Med. 2009;37:418–427. - PubMed
Publication types
MeSH terms
LinkOut - more resources
Full Text Sources
Medical

