

A dynamical feedback model for adaptation in the olfactory transduction pathway
- PMID: 22735517
- PMCID: PMC3379019
- DOI: 10.1016/j.bpj.2012.04.040
A dynamical feedback model for adaptation in the olfactory transduction pathway
Abstract
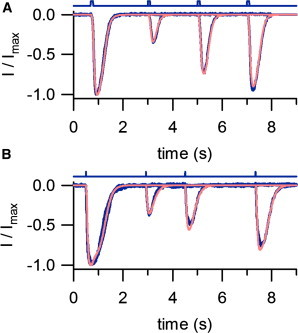
Olfactory transduction exhibits two distinct types of adaptation, which we denote multipulse and step adaptation. In terms of measured transduction current, multipulse adaptation appears as a decrease in the amplitude of the second of two consecutive responses when the olfactory neuron is stimulated with two brief pulses. Step adaptation occurs in response to a sustained steplike stimulation and is characterized by a return to a steady-state current amplitude close to the prestimulus value, after a transient peak. In this article, we formulate a dynamical model of the olfactory transduction pathway, which includes the kinetics of the CNG channels, the concentration of Ca ions flowing through them, and the Ca-complexes responsible for the regulation. Based on this model, a common dynamical explanation for the two types of adaptation is suggested. We show that both forms of adaptation can be well described using different time constants for the kinetics of Ca ions (faster) and the kinetics of the feedback mechanisms (slower). The model is validated on experimental data collected in voltage-clamp conditions using different techniques and animal species.
Copyright © 2012 Biophysical Society. Published by Elsevier Inc. All rights reserved.
Figures


Similar articles
-
Mechanisms of regulation of olfactory transduction and adaptation in the olfactory cilium.PLoS One. 2014 Aug 21;9(8):e105531. doi: 10.1371/journal.pone.0105531. eCollection 2014. PLoS One. 2014. PMID: 25144232 Free PMC article.
-
Oscillatory current responses of olfactory receptor neurons to odorants and computer simulation based on a cyclic AMP transduction model.Chem Senses. 2002 Nov;27(9):789-801. doi: 10.1093/chemse/27.9.789. Chem Senses. 2002. PMID: 12438204
-
Cross-adaptation between olfactory responses induced by two subgroups of odorant molecules.J Gen Physiol. 2003 Sep;122(3):255-64. doi: 10.1085/jgp.200308867. J Gen Physiol. 2003. PMID: 12939391 Free PMC article.
-
The cellular and molecular basis of odor adaptation.Chem Senses. 2000 Aug;25(4):473-81. doi: 10.1093/chemse/25.4.473. Chem Senses. 2000. PMID: 10944513 Review.
-
Tuning outer segment Ca2+ homeostasis to phototransduction in rods and cones.Adv Exp Med Biol. 2002;514:179-203. doi: 10.1007/978-1-4615-0121-3_11. Adv Exp Med Biol. 2002. PMID: 12596922 Review.
Cited by
-
The long tale of the calcium activated Cl- channels in olfactory transduction.Channels (Austin). 2017 Sep 3;11(5):399-414. doi: 10.1080/19336950.2017.1307489. Epub 2017 Mar 16. Channels (Austin). 2017. PMID: 28301269 Free PMC article. Review.
-
A molecular odorant transduction model and the complexity of spatio-temporal encoding in the Drosophila antenna.PLoS Comput Biol. 2020 Apr 14;16(4):e1007751. doi: 10.1371/journal.pcbi.1007751. eCollection 2020 Apr. PLoS Comput Biol. 2020. PMID: 32287275 Free PMC article.
-
Ca2+-activated Cl- current ensures robust and reliable signal amplification in vertebrate olfactory receptor neurons.Proc Natl Acad Sci U S A. 2019 Jan 15;116(3):1053-1058. doi: 10.1073/pnas.1816371116. Epub 2018 Dec 31. Proc Natl Acad Sci U S A. 2019. PMID: 30598447 Free PMC article.
-
Slow Inactivation of Sodium Channels Contributes to Short-Term Adaptation in Vomeronasal Sensory Neurons.eNeuro. 2022 May 17;9(3):ENEURO.0471-21.2022. doi: 10.1523/ENEURO.0471-21.2022. Print 2022 May-Jun. eNeuro. 2022. PMID: 35487703 Free PMC article.
-
Mechanisms of regulation of olfactory transduction and adaptation in the olfactory cilium.PLoS One. 2014 Aug 21;9(8):e105531. doi: 10.1371/journal.pone.0105531. eCollection 2014. PLoS One. 2014. PMID: 25144232 Free PMC article.
References
-
- Shepherd G.M. 3rd ed. Oxford University Press; New York: 1994. Neurobiology.
-
- Alon U., Surette M.G., Leibler S. Robustness in bacterial chemotaxis. Nature. 1999;397:168–171. - PubMed
Publication types
MeSH terms
Substances
LinkOut - more resources
Full Text Sources
