

Higher plant photosystem II light-harvesting antenna, not the reaction center, determines the excited-state lifetime-both the maximum and the nonphotochemically quenched
- PMID: 22735526
- PMCID: PMC3379028
- DOI: 10.1016/j.bpj.2012.05.004
Higher plant photosystem II light-harvesting antenna, not the reaction center, determines the excited-state lifetime-both the maximum and the nonphotochemically quenched
Abstract
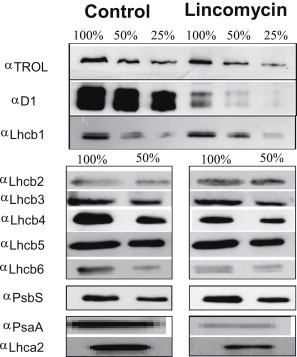
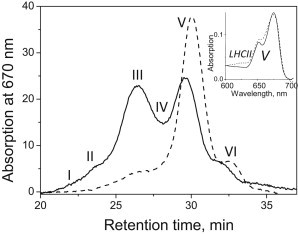
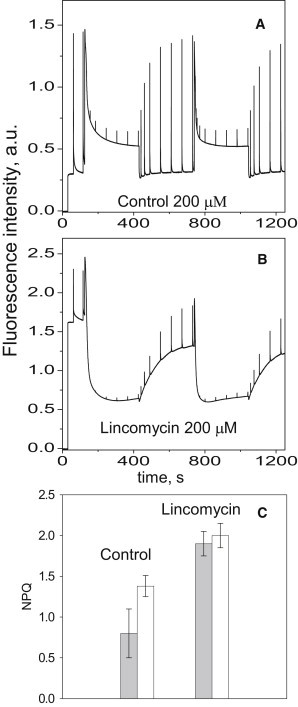
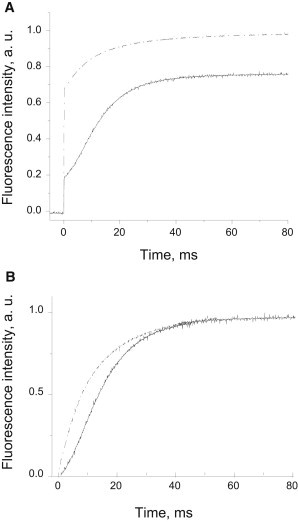
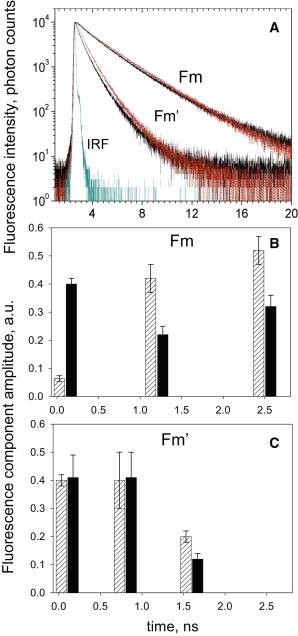
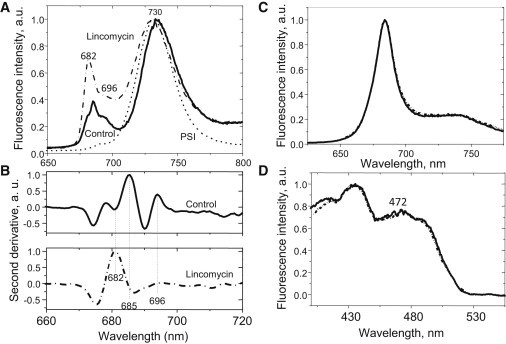
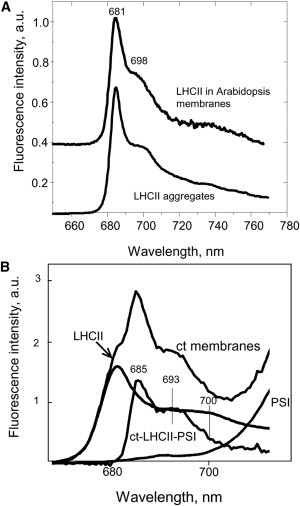
The maximum chlorophyll fluorescence lifetime in isolated photosystem II (PSII) light-harvesting complex (LHCII) antenna is 4 ns; however, it is quenched to 2 ns in intact thylakoid membranes when PSII reaction centers (RCIIs) are closed (Fm). It has been proposed that the closed state of RCIIs is responsible for the quenching. We investigated this proposal using a new, to our knowledge, model system in which the concentration of RCIIs was highly reduced within the thylakoid membrane. The system was developed in Arabidopsis thaliana plants under long-term treatment with lincomycin, a chloroplast protein synthesis inhibitor. The treatment led to 1), a decreased concentration of RCIIs to 10% of the control level and, interestingly, an increased antenna component; 2), an average reduction in the yield of photochemistry to 0.2; and 3), an increased nonphotochemical chlorophyll fluorescence quenching (NPQ). Despite these changes, the average fluorescence lifetimes measured in Fm and Fm' (with NPQ) states were nearly identical to those obtained from the control. A 77 K fluorescence spectrum analysis of treated PSII membranes showed the typical features of preaggregation of LHCII, indicating that the state of LHCII antenna in the dark-adapted photosynthetic membrane is sufficient to determine the 2 ns Fm lifetime. Therefore, we conclude that the closed RCs do not cause quenching of excitation in the PSII antenna, and play no role in the formation of NPQ.
Copyright © 2012 Biophysical Society. Published by Elsevier Inc. All rights reserved.
Figures
Similar articles
-
A novel method produces native light-harvesting complex II aggregates from the photosynthetic membrane revealing their role in nonphotochemical quenching.J Biol Chem. 2020 Dec 18;295(51):17816-17826. doi: 10.1074/jbc.RA120.016181. J Biol Chem. 2020. PMID: 33454016 Free PMC article.
-
PsbS protein modulates non-photochemical chlorophyll fluorescence quenching in membranes depleted of photosystems.J Photochem Photobiol B. 2015 Nov;152(Pt B):301-7. doi: 10.1016/j.jphotobiol.2015.07.016. Epub 2015 Jul 26. J Photochem Photobiol B. 2015. PMID: 26233261
-
PHOTOSYSTEM II PROTEIN33, a protein conserved in the plastid lineage, is associated with the chloroplast thylakoid membrane and provides stability to photosystem II supercomplexes in Arabidopsis.Plant Physiol. 2015 Feb;167(2):481-92. doi: 10.1104/pp.114.253336. Epub 2014 Dec 15. Plant Physiol. 2015. PMID: 25511433 Free PMC article.
-
Energy-Dependent Non-Photochemical Quenching: PsbS, LhcSR, and Other Players.Biochemistry (Mosc). 2025 Jan;90(1):44-60. doi: 10.1134/S000629792460371X. Biochemistry (Mosc). 2025. PMID: 40058973 Review.
-
Light harvesting control in plants.FEBS Lett. 2018 Sep;592(18):3030-3039. doi: 10.1002/1873-3468.13111. Epub 2018 Jun 4. FEBS Lett. 2018. PMID: 29797317 Review.
Cited by
-
Spruce versus Arabidopsis: different strategies of photosynthetic acclimation to light intensity change.Photosynth Res. 2022 Oct;154(1):21-40. doi: 10.1007/s11120-022-00949-0. Epub 2022 Aug 18. Photosynth Res. 2022. PMID: 35980499
-
Natural strategies for photosynthetic light harvesting.Nat Chem Biol. 2014 Jul;10(7):492-501. doi: 10.1038/nchembio.1555. Nat Chem Biol. 2014. PMID: 24937067 Review.
-
Acclimation to white light in a far-red light specialist: insights from Acaryochloris marina MBIC11017.New Phytol. 2025 Jul;247(1):128-143. doi: 10.1111/nph.70188. Epub 2025 May 5. New Phytol. 2025. PMID: 40325848 Free PMC article.
-
Coupling of excitation energy to photochemistry in natural marine phytoplankton communities under iron stress.Proc Natl Acad Sci U S A. 2025 Aug 5;122(31):e2511916122. doi: 10.1073/pnas.2511916122. Epub 2025 Jul 29. Proc Natl Acad Sci U S A. 2025. PMID: 40729384
-
Antenna Protein Clustering In Vitro Unveiled by Fluorescence Correlation Spectroscopy.Int J Mol Sci. 2021 Mar 15;22(6):2969. doi: 10.3390/ijms22062969. Int J Mol Sci. 2021. PMID: 33804002 Free PMC article.
References
-
- Allen J.F., de Paula W.B.M., Nield J. A structural phylogenetic map for chloroplast photosynthesis. Trends Plant Sci. 2011;16:645–655. - PubMed
-
- Kouřil R., Dekker J.P., Boekema E.J. Supramolecular organization of photosystem II in green plants. Biochim. Biophys. Acta. 2012;1817:2–12. - PubMed
-
- Eberhard S., Finazzi G., Wollman F.A. The dynamics of photosynthesis. Annu. Rev. Genet. 2008;42:463–515. - PubMed
Publication types
MeSH terms
Substances
Grants and funding
LinkOut - more resources
Full Text Sources
Other Literature Sources
Miscellaneous
