

Predicting nonspecific ion binding using DelPhi
- PMID: 22735539
- PMCID: PMC3379622
- DOI: 10.1016/j.bpj.2012.05.013
Predicting nonspecific ion binding using DelPhi
Abstract
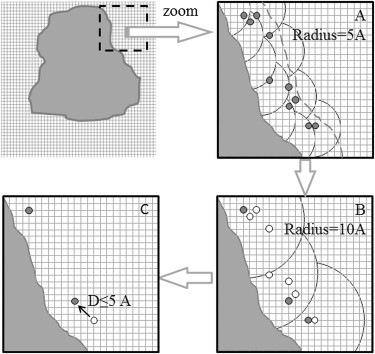
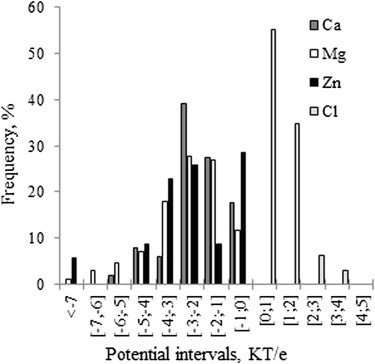
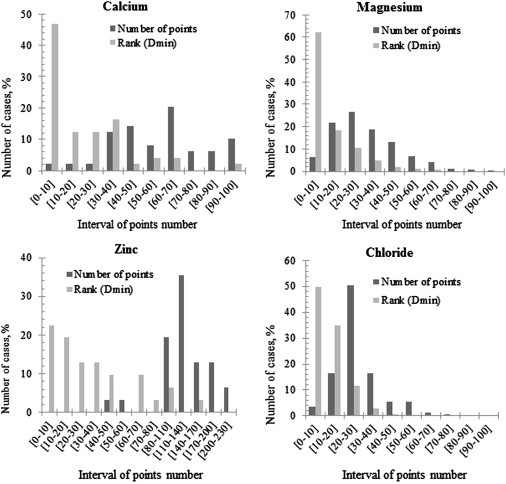
Ions are an important component of the cell and affect the corresponding biological macromolecules either via direct binding or as a screening ion cloud. Although some ion binding is highly specific and frequently associated with the function of the macromolecule, other ions bind to the protein surface nonspecifically, presumably because the electrostatic attraction is strong enough to immobilize them. Here, we test such a scenario and demonstrate that experimentally identified surface-bound ions are located at a potential that facilitates binding, which indicates that the major driving force is the electrostatics. Without taking into consideration geometrical factors and structural fluctuations, we show that ions tend to be bound onto the protein surface at positions with strong potential but with polarity opposite to that of the ion. This observation is used to develop a method that uses a DelPhi-calculated potential map in conjunction with an in-house-developed clustering algorithm to predict nonspecific ion-binding sites. Although this approach distinguishes only the polarity of the ions, and not their chemical nature, it can predict nonspecific binding of positively or negatively charged ions with acceptable accuracy. One can use the predictions in the Poisson-Boltzmann approach by placing explicit ions in the predicted positions, which in turn will reduce the magnitude of the local potential and extend the limits of the Poisson-Boltzmann equation. In addition, one can use this approach to place the desired number of ions before conducting molecular-dynamics simulations to neutralize the net charge of the protein, because it was shown to perform better than standard screened Coulomb canned routines, or to predict ion-binding sites in proteins. This latter is especially true for proteins that are involved in ion transport, because such ions are loosely bound and very difficult to detect experimentally.
Copyright © 2012 Biophysical Society. Published by Elsevier Inc. All rights reserved.
Figures

Similar articles
-
Statistical investigation of surface bound ions and further development of BION server to include pH and salt dependence.J Comput Chem. 2015 Dec 15;36(32):2381-93. doi: 10.1002/jcc.24218. Epub 2015 Oct 20. J Comput Chem. 2015. PMID: 26484964
-
BION-2: Predicting Positions of Non-Specifically Bound Ions on Protein Surface by a Gaussian-Based Treatment of Electrostatics.Int J Mol Sci. 2020 Dec 29;22(1):272. doi: 10.3390/ijms22010272. Int J Mol Sci. 2020. PMID: 33383946 Free PMC article.
-
BION web server: predicting non-specifically bound surface ions.Bioinformatics. 2013 Mar 15;29(6):805-6. doi: 10.1093/bioinformatics/btt032. Epub 2013 Feb 3. Bioinformatics. 2013. PMID: 23380591 Free PMC article.
-
A repulsive field: advances in the electrostatics of the ion atmosphere.Curr Opin Chem Biol. 2008 Dec;12(6):619-25. doi: 10.1016/j.cbpa.2008.10.010. Epub 2008 Dec 8. Curr Opin Chem Biol. 2008. PMID: 19081286 Free PMC article. Review.
-
Continuum molecular electrostatics, salt effects, and counterion binding--a review of the Poisson-Boltzmann theory and its modifications.Biopolymers. 2008 Feb;89(2):93-113. doi: 10.1002/bip.20877. Biopolymers. 2008. PMID: 17969016 Review.
Cited by
-
DelPhiPKa: Including salt in the calculations and enabling polar residues to titrate.Proteins. 2018 Dec;86(12):1277-1283. doi: 10.1002/prot.25608. Epub 2018 Oct 26. Proteins. 2018. PMID: 30252159 Free PMC article.
-
DelPhi Suite: New Developments and Review of Functionalities.J Comput Chem. 2019 Oct 30;40(28):2502-2508. doi: 10.1002/jcc.26006. Epub 2019 Jun 25. J Comput Chem. 2019. PMID: 31237360 Free PMC article.
-
A reinforcement learning approach for protein-ligand binding pose prediction.BMC Bioinformatics. 2022 Sep 8;23(1):368. doi: 10.1186/s12859-022-04912-7. BMC Bioinformatics. 2022. PMID: 36076158 Free PMC article.
-
Features of CPB: a Poisson-Boltzmann solver that uses an adaptive Cartesian grid.J Comput Chem. 2015 Feb 5;36(4):235-43. doi: 10.1002/jcc.23791. Epub 2014 Nov 27. J Comput Chem. 2015. PMID: 25430617 Free PMC article.
-
Chronic Beryllium Disease: revealing the role of beryllium ion and small peptides binding to HLA-DP2.PLoS One. 2014 Nov 4;9(11):e111604. doi: 10.1371/journal.pone.0111604. eCollection 2014. PLoS One. 2014. PMID: 25369028 Free PMC article.
References
-
- Müller P., Köpke S., Sheldrick G.M. Is the bond-valence method able to identify metal atoms in protein structures? Acta Crystallogr. D Biol. Crystallogr. 2003;59:32–37. - PubMed
-
- Pyle A.M. Metal ions in the structure and function of RNA. J. Biol. Inorg. Chem. 2002;7:679–690. - PubMed
-
- Vyas S.B., Duffy L.K. Stabilization of secondary structure of Alzheimer β-protein by aluminum(III) ions and D-Asp substitutions. Biochem. Biophys. Res. Commun. 1995;206:718–723. - PubMed
-
- Lee Y.M., Lim C. Physical basis of structural and catalytic Zn-binding sites in proteins. J. Mol. Biol. 2008;379:545–553. - PubMed
-
- Mcainsh M.R., Brownlee C., Hetherington A.M. Calcium ions as second messengers in guard cell signal transduction. Physiol. Plant. 1997;100:16–29.
Publication types
MeSH terms
Substances
Grants and funding
LinkOut - more resources
Full Text Sources
Other Literature Sources
