

Fluorescence fluctuation spectroscopy enables quantitative imaging of single mRNAs in living cells
- PMID: 22735544
- PMCID: PMC3379624
- DOI: 10.1016/j.bpj.2012.05.017
Fluorescence fluctuation spectroscopy enables quantitative imaging of single mRNAs in living cells
Abstract
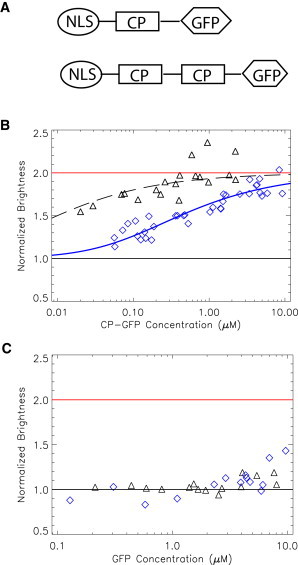
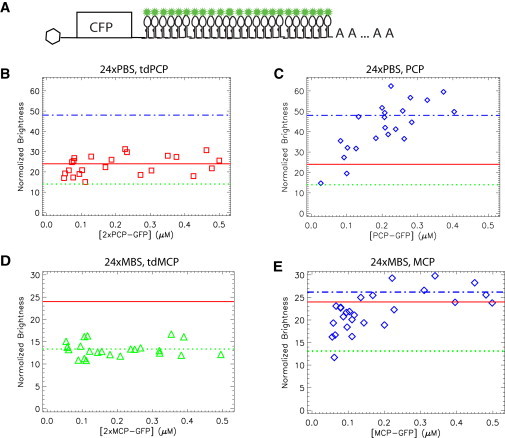
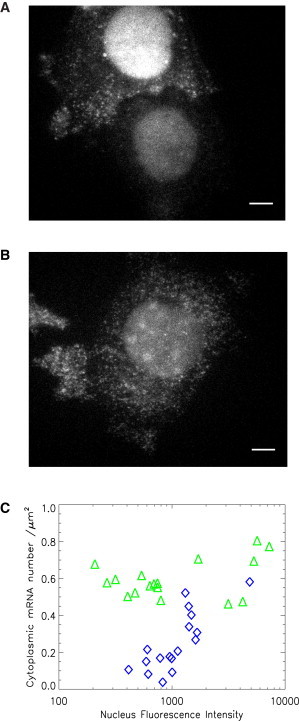
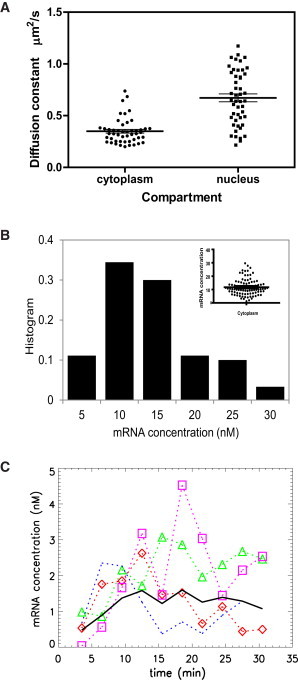
Imaging mRNA with single-molecule sensitivity in live cells has become an indispensable tool for quantitatively studying RNA biology. The MS2 system has been extensively used due to its unique simplicity and sensitivity. However, the levels of the coat protein needed for consistent labeling of mRNAs limits the sensitivity and quantitation of this technology. Here, we applied fluorescence fluctuation spectroscopy to quantitatively characterize and enhance the MS2 system. Surprisingly, we found that a high fluorescence background resulted from inefficient dimerization of fluorescent protein (FP)-labeled MS2 coat protein (MCP). To mitigate this problem, we used a single-chain tandem dimer of MCP (tdMCP) that significantly increased the uniformity and sensitivity of mRNA labeling. Furthermore, we characterized the PP7 coat protein and the binding to its respective RNA stem loop. We conclude that the PP7 system performs better for RNA labeling. Finally, we used these improvements to study endogenous β-actin mRNA, which has 24xMS2 binding sites inserted into the 3' untranslated region. The tdMCP-FP allowed uniform RNA labeling and provided quantitative measurements of endogenous mRNA concentration and diffusion. This work provides a foundation for quantitative spectroscopy and imaging of single mRNAs directly in live cells.
Copyright © 2012 Biophysical Society. Published by Elsevier Inc. All rights reserved.
Figures
Similar articles
-
Stem-loop RNA labeling can affect nuclear and cytoplasmic mRNA processing.RNA. 2017 Feb;23(2):134-141. doi: 10.1261/rna.057786.116. Epub 2016 Nov 10. RNA. 2017. PMID: 28096443 Free PMC article.
-
Imaging Single mRNA Dynamics in Live Neurons and Brains.Methods Enzymol. 2016;572:51-64. doi: 10.1016/bs.mie.2016.02.015. Epub 2016 Mar 22. Methods Enzymol. 2016. PMID: 27241749
-
MS2 Labeling of Endogenous Beta-Actin mRNA Does Not Result in Stabilization of Degradation Intermediates.Mol Cells. 2019 Apr 30;42(4):356-362. doi: 10.14348/molcells.2019.2398. Mol Cells. 2019. PMID: 30841028 Free PMC article.
-
RNA voyeurism: A coming of age story.Methods. 2016 Apr 1;98:10-17. doi: 10.1016/j.ymeth.2015.11.024. Epub 2015 Nov 27. Methods. 2016. PMID: 26638774 Review.
-
Following the messenger: Recent innovations in live cell single molecule fluorescence imaging.Wiley Interdiscip Rev RNA. 2020 Jul;11(4):e1587. doi: 10.1002/wrna.1587. Epub 2020 Jan 28. Wiley Interdiscip Rev RNA. 2020. PMID: 31990126 Free PMC article. Review.
Cited by
-
TriTag: an integrative tool to correlate chromatin dynamics and gene expression in living cells.Nucleic Acids Res. 2020 Dec 16;48(22):e127. doi: 10.1093/nar/gkaa906. Nucleic Acids Res. 2020. PMID: 33104788 Free PMC article.
-
New Advances in Using Virus-like Particles and Related Technologies for Eukaryotic Genome Editing Delivery.Int J Mol Sci. 2022 Aug 6;23(15):8750. doi: 10.3390/ijms23158750. Int J Mol Sci. 2022. PMID: 35955895 Free PMC article. Review.
-
Long-term imaging of individual mRNA molecules in living cells.Cell Rep Methods. 2022 May 25;2(6):100226. doi: 10.1016/j.crmeth.2022.100226. eCollection 2022 Jun 20. Cell Rep Methods. 2022. PMID: 35784652 Free PMC article.
-
Delivering SaCas9 mRNA by lentivirus-like bionanoparticles for transient expression and efficient genome editing.Nucleic Acids Res. 2019 May 7;47(8):e44. doi: 10.1093/nar/gkz093. Nucleic Acids Res. 2019. PMID: 30759231 Free PMC article.
-
Assembly and Molecular Architecture of the Phosphoinositide 3-Kinase p85α Homodimer.J Biol Chem. 2015 Dec 18;290(51):30390-405. doi: 10.1074/jbc.M115.689604. Epub 2015 Oct 16. J Biol Chem. 2015. PMID: 26475863 Free PMC article.
References
-
- Tyagi S. Imaging intracellular RNA distribution and dynamics in living cells. Nat. Methods. 2009;6:331–338. - PubMed
-
- Cha B.J., Koppetsch B.S., Theurkauf W.E. In vivo analysis of Drosophila bicoid mRNA localization reveals a novel microtubule-dependent axis specification pathway. Cell. 2001;106:35–46. - PubMed
Publication types
MeSH terms
Substances
Grants and funding
LinkOut - more resources
Full Text Sources
Other Literature Sources
Research Materials
Miscellaneous
