. 2012 Nov;57(11):2846-55.
doi: 10.1007/s10620-012-2292-3. Epub 2012 Jun 27.

Paradoxically increased FOXP3+ T cells in IBD do not preferentially express the isoform of FOXP3 lacking exon 2

Affiliations

Paradoxically increased FOXP3+ T cells in IBD do not preferentially express the isoform of FOXP3 lacking exon 2

James D Lord et al. Dig Dis Sci. 2012 Nov.

Abstract

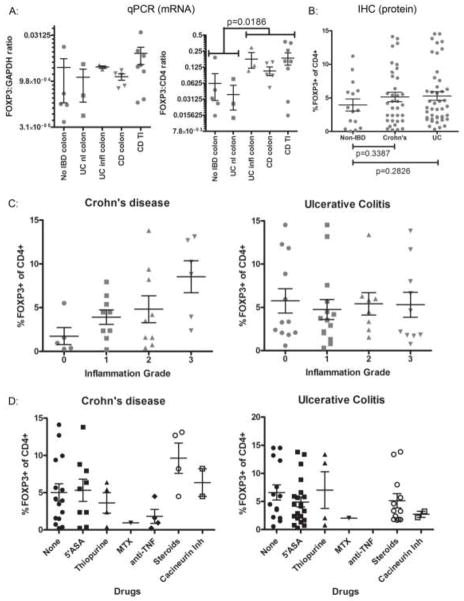
Background: Forkhead box P3 (FOXP3)+ regulatory T cells (Tregs) are critical for controlling inflammation in the gastrointestinal tract. There is a paradoxical increase of mucosal FOXP3+ T cells in patients with inflammatory bowel disease (IBD). These FOXP3+ cells were recently shown to include interleukin (IL)-17A-producing cells in Crohn's disease, resembling Th17 cells implicated in autoimmune diseases. FOXP3 inhibits IL-17A production, but a naturally occurring splice variant of FOXP3 lacking exon 2 (Δexon2) cannot.

Aims: We hypothesized that IBD patients preferentially express the Δexon2 variant of FOXP3 so the paradoxically increased mucosal Tregs in IBD could represent cells expressing only Δexon2.

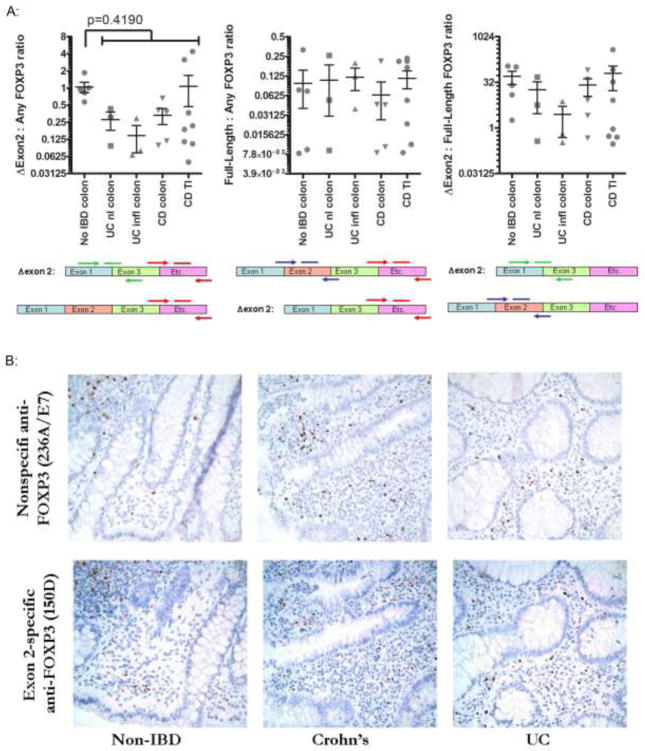
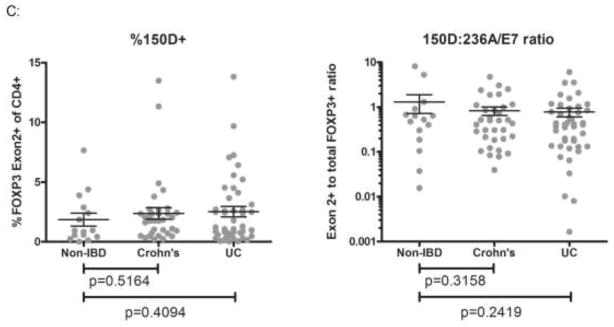
Methods: We used antibodies and primers that can distinguish between the full-length and Δexon2 splice variant of FOXP3 to evaluate expression of these isoforms in human intestinal tissue by immunohistochemistry and quantitative polymerase chain reaction (PCR), respectively.

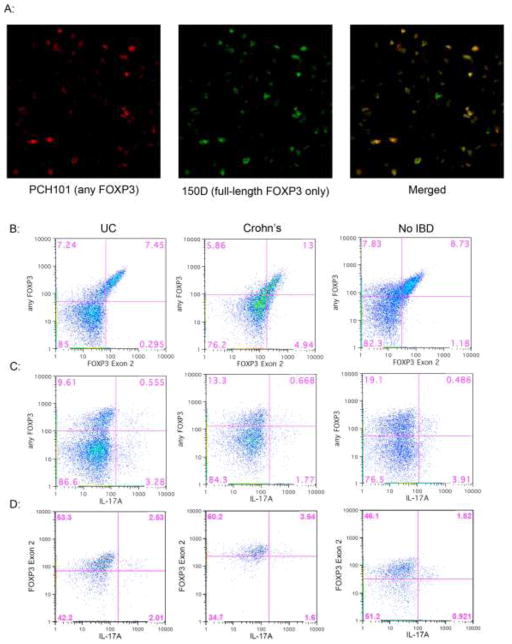
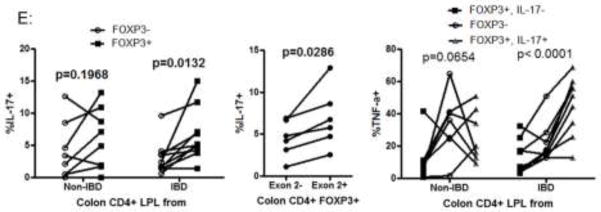
Results: No difference in the expression pattern of Δexon2 relative to full-length FOXP3 was seen in ulcerative colitis or Crohn's disease versus non-IBD controls. By immunofluorescence microscopy and flow cytometry, we also did not find individual cells which expressed FOXP3 protein exclusively in the Δexon2 isoform in either IBD or control tissue. FOXP3+ mucosal CD4+ T cells from both IBD and control specimens were able to make IL-17A in vitro after phorbol myristate acetate (PMA) and ionomycin stimulation, but these cells did not preferentially express Δexon2.

Conclusions: Our data do not support the hypothesis that selective expression of FOXP3 in the Δexon2 isoform accounts for the inability of copious FOXP3+ T cells to inhibit inflammation or IL-17 expression in IBD.


Figures

Figure 1
Figure 1. FOXP3+ cells are plentiful in IBD
A. mRNA was harvested from intestinal mucosa snap-frozen from surgically resected specimens, and evaluated by qPCR for the quantity of FOXP3 transcripts relative to CD4 (right) or GAPDH (left) transcripts. In the right panel, a p-value is shown for a Student’s t-test comparing pooled data points under the two brackets shown. B. Serial sections of FFPE colonoscopic biopsies were stained by IHC with antibodies to FOXP3 or CD4 and digitally photographed, and the total number of FOXP3+ or CD4+ cells were quantified by ImageJ, and used to estimate the percent of total CD4+ cells that were FOXP3+ Tregs. P-values are shown for Student’s t-tests comparing non-IBD specimens with either Crohn’s or UC specimens. C. H&E-stained serial sections of the samples in B from IBD patients were graded for neutrophilic inflammation by a single, blinded GI pathologist, and the Treg frequency in B was re-plotted relative to Crohn’s (left) or UC (right) inflammatory grade. D. Data in B was re-plotted relative to whether a patient was using a particular medication at the time of biopsy (note: some patients were using more than one agent, and so may be represented in multiple columns). For all IHC plots, each dot represents a unique colonoscopy.
Figure 2
Figure 2. Cells expressing full-length FOXP3 are plentiful in IBD
A. mRNA was harvested from intestinal mucosa snap-frozen from surgically resected intestine specimens, and evaluated by qPCR using primers to FOXP3 transcripts that either overly an exon 1-exon 3 splice junction (and therefore will only amplify Δexon 2 transcripts) (green arrows), bind within exon 2 (and thus will only amplify full-length FOXP3 transcripts) (blue arrows), or recognize sequence corresponding to C-terminal sequence (and so will amplify both Δexon 2 and full-length FOXP3 transcripts) (red arrows). The ratio of each of these qPCR results to one another are shown for each patient (represented by a unique dot). In the left panel, a p-value for a Student’s t-test comparing no IBD colon to pooled data from all IBD specimens is shown. B. Representative fields are shown from serial sections of colon biopsies from a patient with UC (right), Crohn’s (middle) or no IBD (left) stained by IHC for FOXP3 with antibodies that recognize either the C-terminus of FOXP3 (and thus will not discriminate between full-length and Δexon 2 proteins, clone 236A/E7, upper panels) or sequence encoded by its exon 2 (and thus will only bind full-length protein, not Δexon 2, clone 150D, lower panels). C. Biopsy serial sections from figure 1B were stained by IHC with the FOXP3 exon 2-specific antibody clone 150D, and positive cells were quantified as in figure 1B. The ratio of exon 2-positive cells to either CD4+ (left) or total FOXP3+ (right) cells is shown for each patient (represented as a unique dot). P-values are shown for Student’s t-tests comparing non-IBD specimens with either Crohn’s or UC specimens.
Figure 3
Figure 3. FOXP3+ cells in IBD are Exon 2+
A. A frozen section from the surgically resected MLN of a patient with UC was simultaneously stained with exon-2 specific mouse anti-FOXP3 (clone 150D, green) and nonspecific rat anti-FOXP3 (clone PCH101, red), revealing no FOXP3+ cells recognizable by the latter which were not also expressing exon 2 (merged). B–D: Lamina propria lymphocytes (LPL) from the surgically resected intestines of patients with UC (left) Crohn’s (middle) or no IBD (right) were stimulated overnight with PMA and ionomycin in the presence of brefeldin A and then stained extracellularly for CD3, 4, and 8, and intracellularly with antibodies to the C-terminus (clone 236A/E7, Y-axis in B and C) and Exon 2 region (clone 150D, X-axis in B, Y-axis in D) of FOXP3, as well as IL-17A (X-axis in C and D). Data shown in B and C is gated to include CD3+4+8- cells within the live lymphocyte gate, while data in D is additionally gated to include only FOXP3+ (any isoform) cells. E. Colon LPL from patients without (n=8) or with IBD (n=6 UC, 4 Crohn’s) were stimulated as above and stained for intracellular cytokines and FOXP3. The percent of FOXP3+ and FOXP3- CD3+ CD4+ CD8- cells expressing IL-17 is shown in the left panel, with p-values representing paired t-test comparisons between FOXP3+ and FOXP3- populations. In a subset of the FOXP3+ populations (n=2 Crohn’s, 2 UC and 2 non-IBD patients) which were also stained for Exon2, the percent of Exon2+ and Exon 2- FOXP3+ cells expressing IL-17 is shown in the middle panel, with p-values representing paired t-test comparisons between Exon 2+ and Exon 2- populations. TNF-α expression by FOXP3- and either IL-17+ or IL-17- FOXP3+ CD4+ T cells is shown in the right panel, with p-values representing ANOVA calculations for each cohort.

References

    1. Rudensky AY. Regulatory T cells and Foxp3. Immunol Rev. 2011;241:260–268. - PMC - PubMed
    1. Bennett CL, Christie J, Ramsdell F, et al. The immune dysregulation, polyendocrinopathy, enteropathy, X-linked syndrome (IPEX) is caused by mutations of FOXP3. Nat Genet. 2001;27:20–21. - PubMed
    1. Brunkow ME, Jeffery EW, Hjerrild KA, et al. Disruption of a new forkhead/winged-helix protein, scurfin, results in the fatal lymphoproliferative disorder of the scurfy mouse. Nat Genet. 2001;27:68–73. - PubMed
    1. Patel DD. Escape from tolerance in the human X-linked autoimmunity-allergic disregulation syndrome and the Scurfy mouse. J Clin Invest. 2001;107:155–157. - PMC - PubMed
    1. Wildin RS, Ramsdell F, Peake J, et al. X-linked neonatal diabetes mellitus, enteropathy and endocrinopathy syndrome is the human equivalent of mouse scurfy. Nat Genet. 2001;27:18–20. - PubMed

Publication types

MeSH terms