. 2012 Oct 1;21(19):4225-36.
doi: 10.1093/hmg/dds246. Epub 2012 Jun 26.

A polyglutamine expansion disease protein sequesters PTIP to attenuate DNA repair and increase genomic instability

Affiliations

A polyglutamine expansion disease protein sequesters PTIP to attenuate DNA repair and increase genomic instability

Hong Xiao et al. Hum Mol Genet. .

Abstract

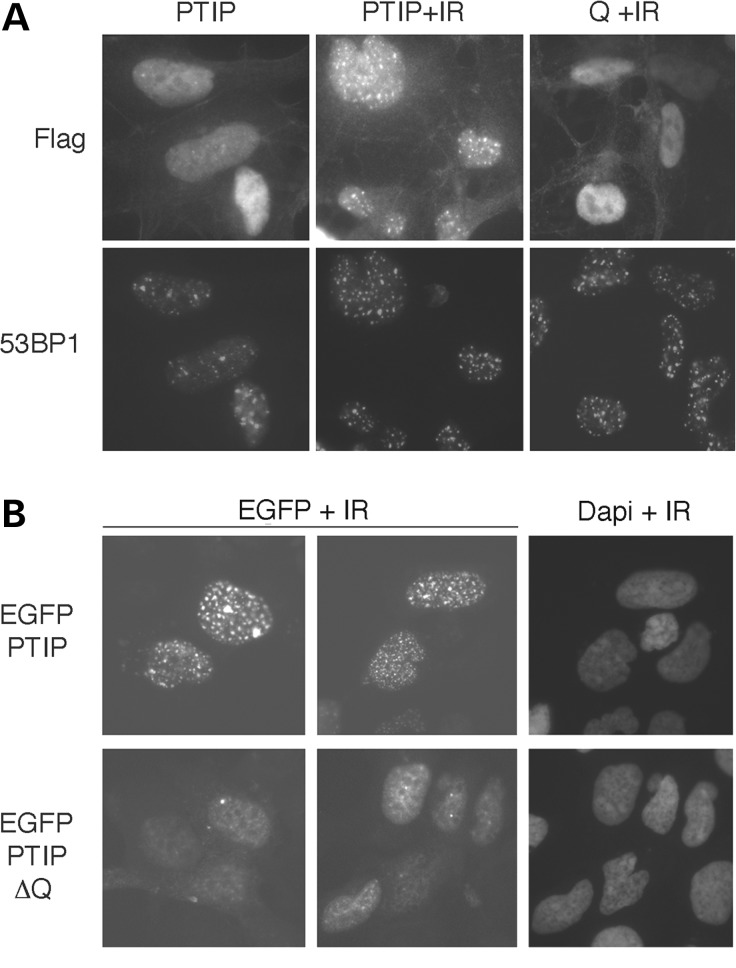
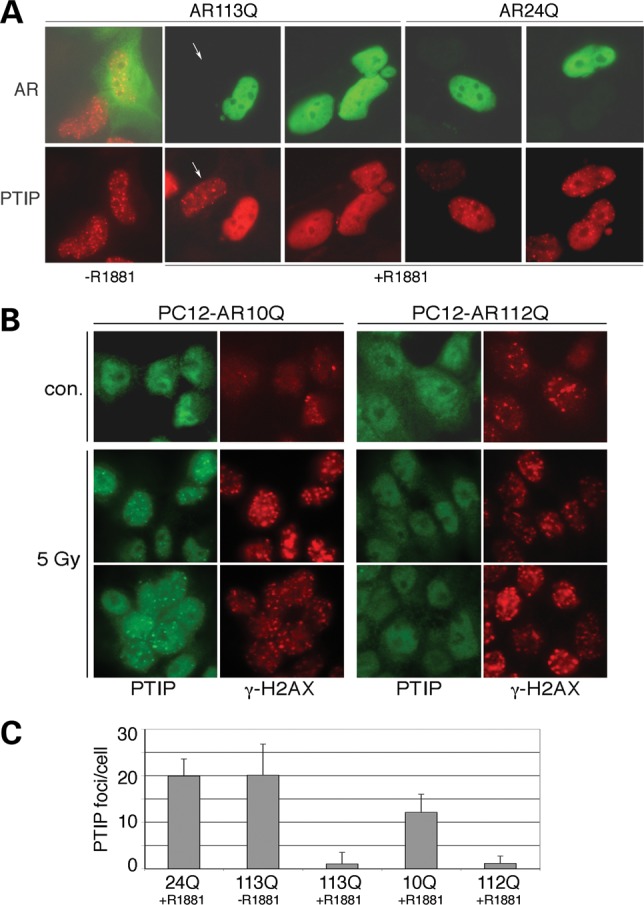
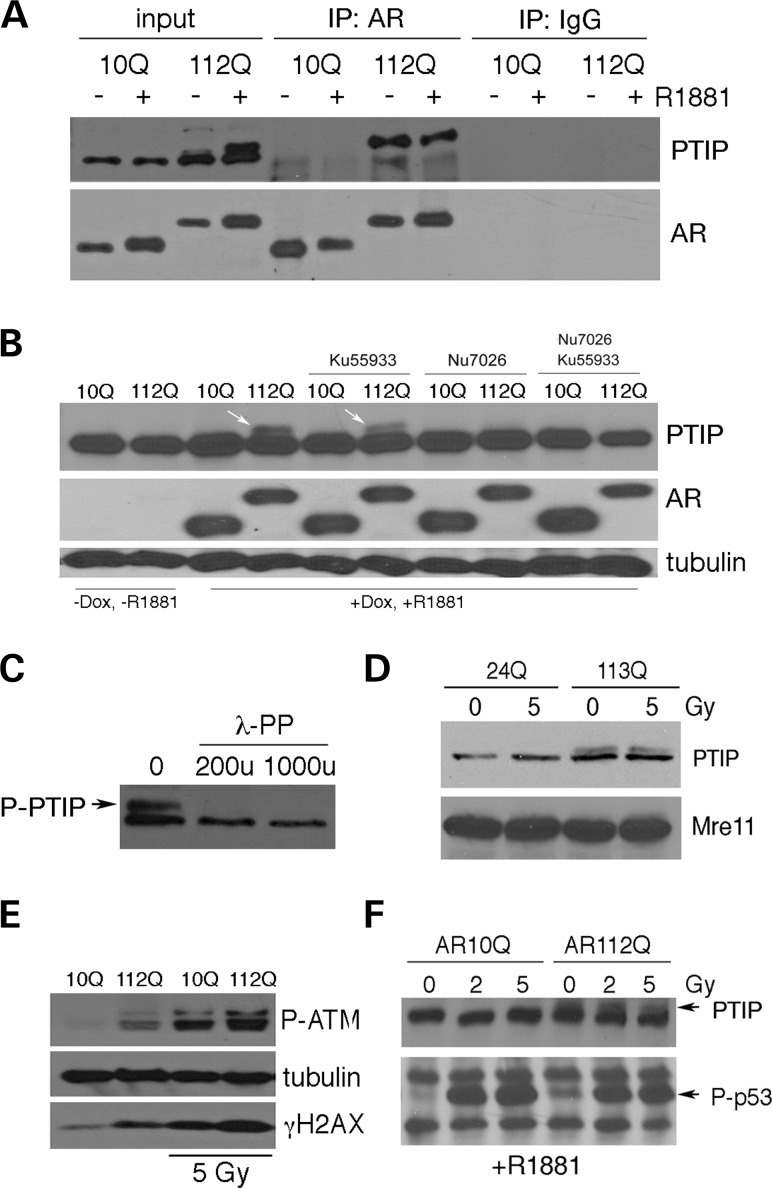
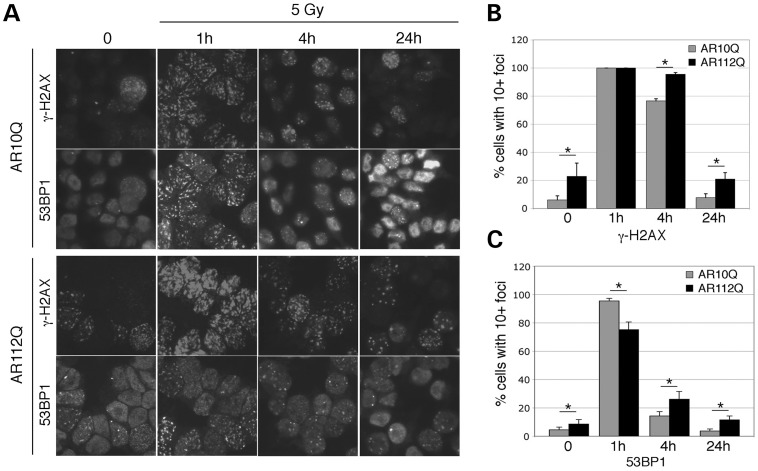
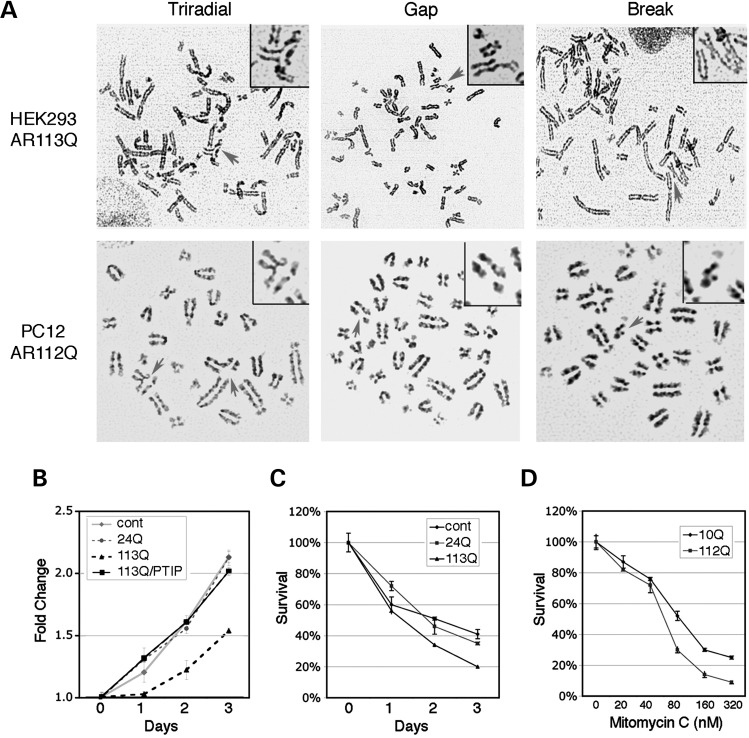
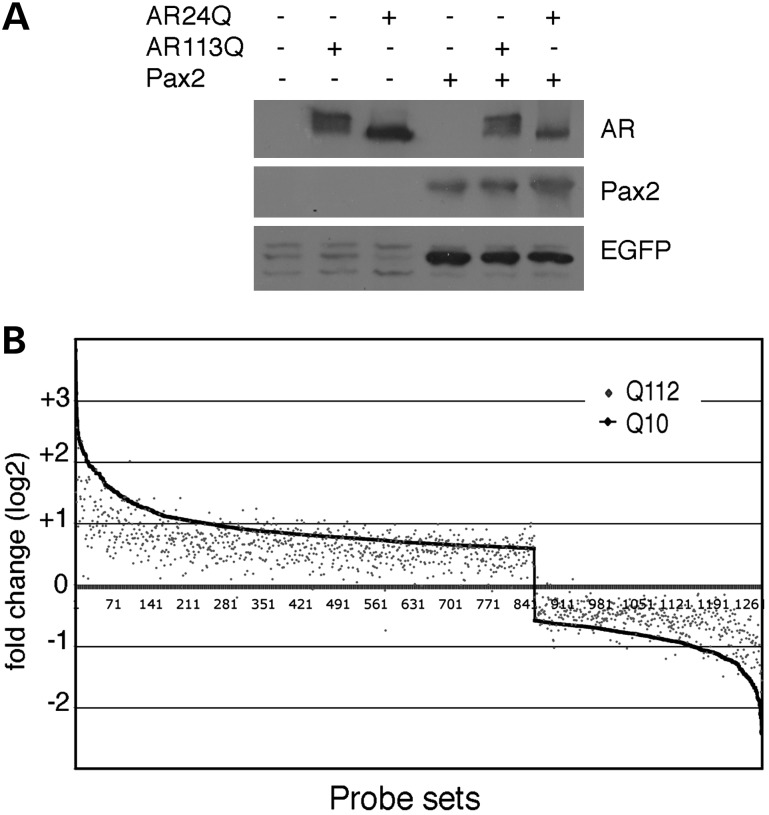
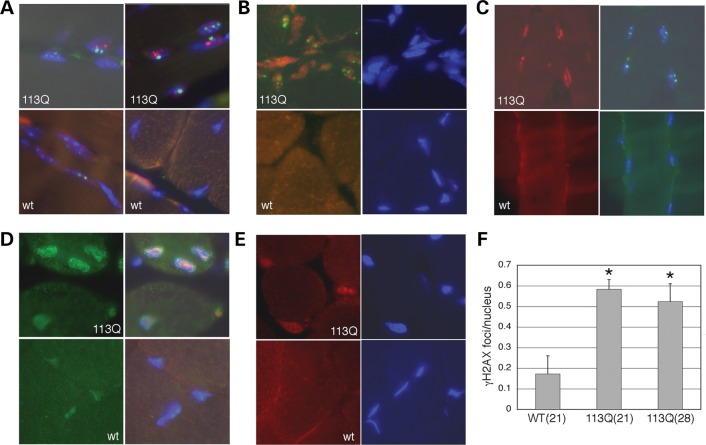
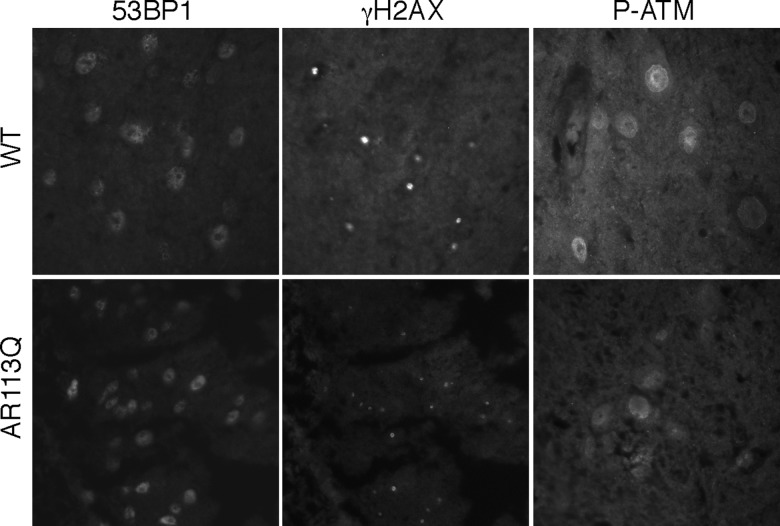
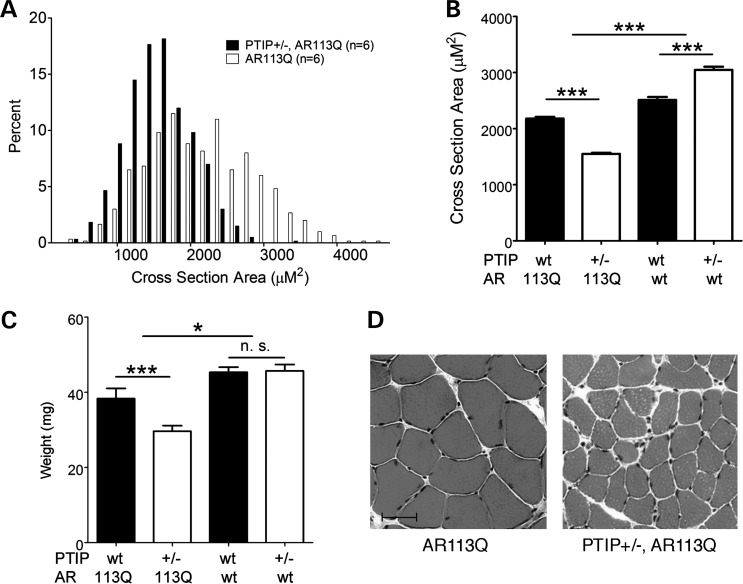
Glutamine (Q) expansion diseases are a family of degenerative disorders caused by the lengthening of CAG triplet repeats present in the coding sequences of seemingly unrelated genes whose mutant proteins drive pathogenesis. Despite all the molecular evidence for the genetic basis of these diseases, how mutant poly-Q proteins promote cell death and drive pathogenesis remains controversial. In this report, we show a specific interaction between the mutant androgen receptor (AR), a protein associated with spinal and bulbar muscular atrophy (SBMA), and the nuclear protein PTIP (Pax Transactivation-domain Interacting Protein), a protein with an unusually long Q-rich domain that functions in DNA repair. Upon exposure to ionizing radiation, PTIP localizes to nuclear foci that are sites of DNA damage and repair. However, the expression of poly-Q AR sequesters PTIP away from radiation-induced nuclear foci. This results in sensitivity to DNA-damaging agents and chromosomal instabilities. In a mouse model of SBMA, evidence for DNA damage is detected in muscle cell nuclei and muscular atrophy is accelerated when one copy of the gene encoding PTIP is removed. These data provide a new paradigm for understanding the mechanisms of cellular degeneration observed in poly-Q expansion diseases.


Figures

Figure 1.
Figure 1.
Effects of the Q domain on PTIP localization. (A) Full-length PTIP or the Q domain only, linked to a nuclear localization signal, was expressed with flag-epitope tags in HEK293 cells and subject to 5 Gy IR (+IR). Cells were stained 1 h post IR with anti-flag and anti-53BP1 as indicated. (B) HEK293 cells expressing either a full-length EGFP-PTIP fusion protein or a Q domain deletion construct (EGFP-PTIP-ΔQ) were exposed to 5 Gy IR and imaged fixed 1 h post irradiation. EGFP was visualized by fluorescent microscopy and nuclei stained with Dapi.
Figure 2.
Figure 2.
Poly-Q AR inhibits PTIP from localization to radiation-induced nuclear foci. (A) Cells stably expressing flag-tagged PTIP HEK293 cells were transfected with AR113Q or AR24Q and stained with antibodies against AR (green) or flag-PTIP (red). All cells were subject to 5 Gy IR and the same field is shown in the top and bottom panels. Without ligand, AR113Q has no effect on PTIP foci; however, PTIP foci are reduced in AR113Q-expressing cells in the presence of R1881. PTIP foci are unaffected in cells not expressing AR113Q (arrow). AR24Q has little effect on PTIP foci formation in response to IR, as PTIP is in foci regardless of whether AR24Q is coexpressed. (B) Endogenous PTIP was examined in PC12 Cells stably expressing either AR10Q or AR112Q before and 1 h after 5 Gy IR. PTIP (green) is observed in nuclear foci after irradiation in AR10Q-expressing rat PC12 cells but not in AR112Q-expressing PC12 cells. The γ-H2AX (red) staining marks IR-induced foci 1 h after 5 Gy exposure and is similar in both cell types. However, more γ-H2AX are observed in AR112Q cells in the absence of IR. (C) Quantitation of IR-induced PTIP-positive foci in transfected HEK293 cells (24Q, 113Q) and in PC12 cells (10Q, 112Q). All cells were subject to 5 Gy IR and stained for PTIP. The numbers of foci were counted in cells expressing AR24Q with ligand, AR113Q without ligand, AR113Q with ligand, AR10Q with ligand and AR112Q with ligand. The mean number of foci/cell is shown with error bars being 1SEM. Note that the SEM is greater than the mean for 113Q + R1881, because many cells had zero PTIP-positive foci. The Student's t-test for two independent variables gave P-values of <0.01 for 113Q + R1881 and 112Q + R1881 compared with espective controls.
Figure 3.
Figure 3.
Interactions between PTIP and poly-Q AR. (A) PC12 cells stably expressing AR10Q or AR112Q were induced with synthetic ligand R1881 and protein lysates immunoprecipitated with anti-AR antibodies as indicated. Addition of ligand induced a slower migrating PTIP isoform (input) in AR112Q cells. The AR112Q protein binds to this slower migrating form of PTIP, whereas AR10Q shows no interaction. (B) The slower migrating form of PTIP is specific for AR112Q PC12 cells after the addition of ligand (arrows). The presence of the slower PTIP isoform is inhibited by the DNA-PKcs inhibitor Nu7026 but not by the ATM inhibitor Ku55933. (C) Lambda phosphatase reduces the slower migrating form of PTIP in AR112Q-expressing cell lysates. (D) Western blot of lysates from transient expression of AR24Q and AR113Q in HEK293 cells. Note slower migrating PTIP isoform is not radiation inducible and only appears when poly-Q AR is expressed. (E) AR112Q induces ATM phosphorylation in PC12 cells and higher levels of γ-H2AX even in the absence of IR. 5 Gy IR activates P-ATM and increases γ-H2AX in both cell types. (F) Western blot of lysates from AR10Q and AR112Q PC12 cells showing p53 phosphorylation in response to IR. Note, P-p53 levels in AR112Q cells are elevated prior to radiation.
Figure 4.
Figure 4.
Resolution of IR-induced nuclear foci. (A) PC12 cells expressing AR10Q or AR112Q were cultured with R1881 and stained with antibodies against γ-H2AX or 53BP1 before (zero) or 1, 4 or 24 h post irradiation. (B) The percentages of cells with 10 or more γ-H2AX-positive nuclear foci were counted in eight independent images for each time point. (C) The percentages of cells with 10 or more 53BP1 nuclear foci were counted from eight fields at each time point. Statistically differences were calculated by the Student's t-test; *P< 0.01 for all comparisons except the 1-h γ-H2AX samples.
Figure 5.
Figure 5.
Genomic instabilities in poly-Q AR-expressing cells. (A) Representative karyotypes are shown with chromosomal abnormalities in AR113Q-expressing HEK293 cells (top panels) or in AR112Q-expressing PC12 cells (bottom panels); triradials, gaps and breaks are indicated by the arrow. (B) Growth curves of HEK293 cells and cells transiently expressing AR24Q, AR113Q or AR113Q + flagPTIP after exposure to 2 Gy IR. Note that overexpression of PTIP rescues AR113Q-dependent effects. (C) Growth curves of HEK293 cells, AR24Q- or AR113Q-expressing cells after treatment with 40 nm CPT. (D) MMC sensitivity of PC12 cells expressing either AR10Q or AR112Q. Survival after 8 days in culture is indicated.
Figure 6.
Figure 6.
Effects of AR112Q on gene expression. (A) HEK293 cells containing an integrated PTIP/Pax reporter gene were transiently transfected with expression plasmids as indicated and lysates western blotted for the EGFP reporter gene. Note, Pax2 activates the EGFP reporter but is unaffected by either AR24Q or AR113Q. (B) Affymetrix microarray analysis of R1881-dependent gene expression in PC12 cells expressing either AR10Q or AR112Q. For AR10Q, 1261 genes were either activated or repressed more than 0.6-fold (log2 scale) in response to ligand addition. These genes are plotted on the x-axis from highest activated to the highest repressed (1–1261). The level of activation or repression in AR112Q cells is then overlaid on this graph, with each gene represented by a single point. Note that the overall pattern of activation and repression is similar between AR10Q and AR112Q, although the absolute level of activation or repression is generally lower for AR112Q.
Figure 7.
Figure 7.
Evidence for the activation of the DNA damage response in AR113Q mice. Immunohistochemistry from muscle sections of AR113Q (113Q) and wt mice are shown in (A)–(E). Genotypes are as indicated. Cell nuclei are stained blue with Dapi. (A) Co-staining of muscle cell nuclei for γ-H2AX (green) and AR (red). Note green nuclear foci are distinct from the AR aggregates seen in AR113Q muscle cells compared to age matched WT controls. (B) Co-staining of γ-H2AX (green) and Ku70 (red) shows increased Ku70 and γ-H2AX foci in AR113Q muscle nuclei. (C) Co-staining for γ-H2AX (green) and 53BP1 (red) shows increased levels of 53BP1 in AR113Q muscle nuclei. (D) Co-staining of P-ATM (green) and 53BP1 (red) shows increased levels P-ATM and 53BP1 in AR113Q muscle cell nuclei. (E) Staining for P-DNA-PKcs (red) shows increased levels in AR113Q nuclei compared with WTs. (F) Quantitation of γ-H2AX foci in sections of muscle from 21-week-old wt or 21- or 28-week-old AR113Q mice. Ten images were taken from each muscle sample, with each image containing more than 50 nuclei, and the number of γ-H2AX foci counted. Data are represented as the average number of foci per nucleus. The P< 0.01 (*) when compared with wt samples. Error bars are 1SEM.
Figure 8.
Figure 8.
Immunostaining of WT and AR113Q spinal cord. Representative sections of the ventral spinal cord are shown stained with antibodies for the indicated proteins. Comparing the WT to AR113Q spinal cord, we did not see any increased evidence of DNA damage or activation of the DNA damage response in nuclei from regions of ventral motor neurons.
Figure 9.
Figure 9.
Enhanced muscle atrophy through reduced Paxip1 gene dosage. (A) Distribution of the cross-sectional area of muscle fibers from histological sections of proximal hind limb muscle taken from AR113Q male mice carrying either 1 or 2 copies of the Paxip1 gene which encodes PTIP (P< 0.001). (B) The cross-sectional area of muscle fibers of all examined genotypes (mean ± SEM) (***P< 0.001). (C) Hind limb muscle mass (mean ± SEM) (***P< 0.001, *P< 0.05, n.s., not significant). (D) Representative histological sections of muscle fibers taken from AR113Q mice with indicated genetic background. Scale bar = 50 μm.

Similar articles

Cited by

References

    1. La Spada A.R., Taylor J.P. Repeat expansion disease: progress and puzzles in disease pathogenesis. Nat. Rev. Genet. 2010;11:247–258. - PMC - PubMed
    1. Takahashi T., Katada S., Onodera O. Polyglutamine diseases: where does toxicity come from? what is toxicity? where are we going? J. Mol. Cell. Biol. 2010;2:180–191. - PubMed
    1. Takeyama K., Ito S., Yamamoto A., Tanimoto H., Furutani T., Kanuka H., Miura M., Tabata T., Kato S. Androgen-dependent neurodegeneration by polyglutamine-expanded human androgen receptor in Drosophila. Neuron. 2002;35:855–864. - PubMed
    1. Montie H.L., Cho M.S., Holder L., Liu Y., Tsvetkov A.S., Finkbeiner S., Merry D.E. Cytoplasmic retention of polyglutamine-expanded androgen receptor ameliorates disease via autophagy in a mouse model of spinal and bulbar muscular atrophy. Hum. Mol. Genet. 2009;18:1937–1950. - PMC - PubMed
    1. Klement I.A., Skinner P.J., Kaytor M.D., Yi H., Hersch S.M., Clark H.B., Zoghbi H.Y., Orr H.T. Ataxin-1 nuclear localization and aggregation: role in polyglutamine-induced disease in SCA1 transgenic mice. Cell. 1998;95:41–53. - PubMed

Publication types

MeSH terms