Review
. 2012 Aug;5(8-9):617-28.
doi: 10.1002/jbio.201200037. Epub 2012 Jun 27.

Photonic crystal enhanced fluorescence for early breast cancer biomarker detection

Affiliations
Review

Photonic crystal enhanced fluorescence for early breast cancer biomarker detection

Brian T Cunningham et al. J Biophotonics. 2012 Aug.

Abstract

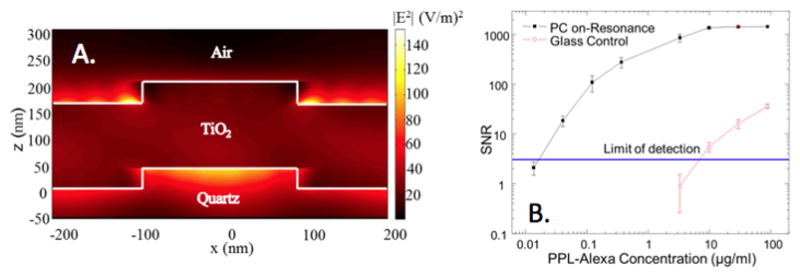
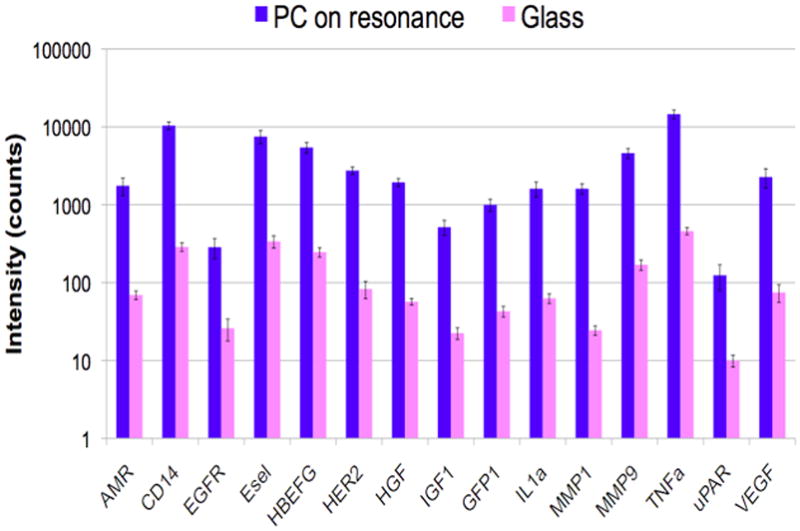
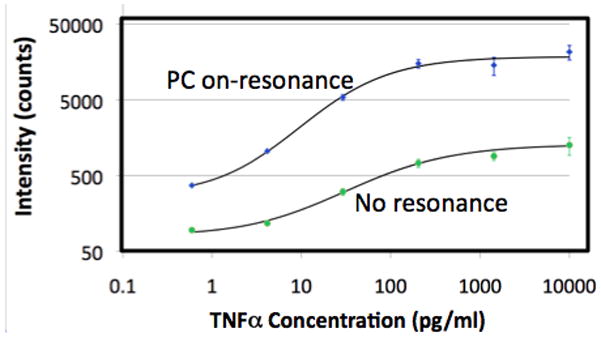
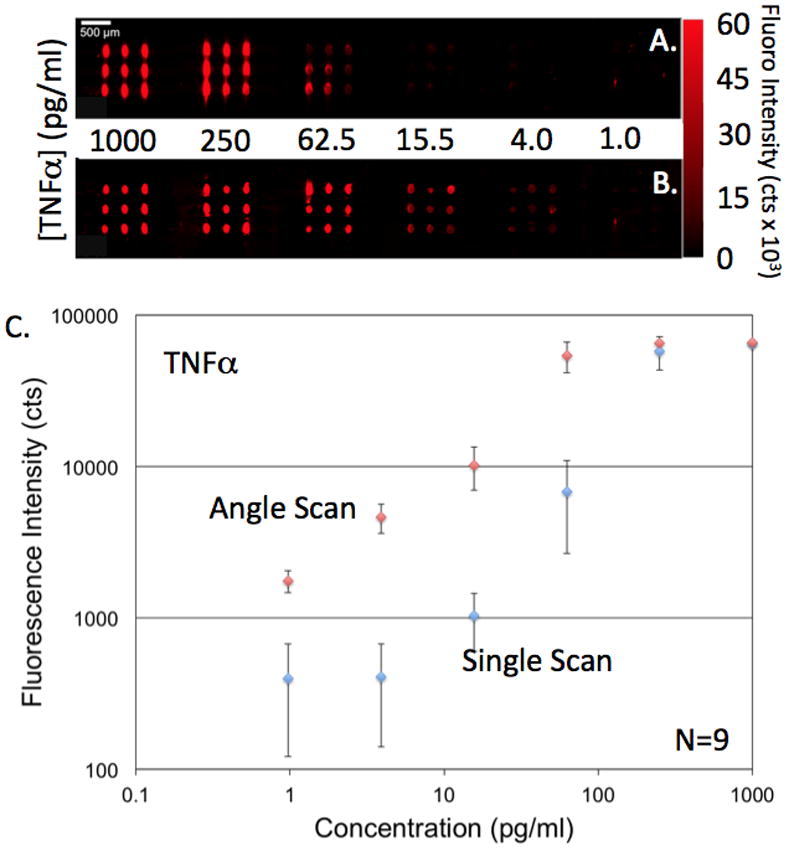
Photonic crystal surfaces offer a compelling platform for improving the sensitivity of surface-based fluorescent assays used in disease diagnostics. Through the complementary processes of photonic crystal enhanced excitation and enhanced extraction, a periodic dielectric-based nanostructured surface can simultaneously increase the electric field intensity experienced by surface-bound fluorophores and increase the collection efficiency of emitted fluorescent photons. Through the ability to inexpensively fabricate photonic crystal surfaces over substantial surface areas, they are amenable to single-use applications in biological sensing, such as disease biomarker detection in serum. In this review, we will describe the motivation for implementing high-sensitivity, multiplexed biomarker detection in the context of breast cancer diagnosis. We will summarize recent efforts to improve the detection limits of such assays though the use of photonic crystal surfaces. Reduction of detection limits is driven by low autofluorescent substrates for photonic crystal fabrication, and detection instruments that take advantage of their unique features.

Keywords: biomarkers; fluorescence enhancement; nanostructured surface; photonic crystal.


Figures

Figure 1
Figure 1
A. Schematic diagram of the current ELISA microarray platform. Conventional glass microscope slides (1×3 in2) are printed with 16 identical wells, with vertical spacing that is the same as a 96-well microplate. B. Each well contains an ELISA microarray chip with over 20 assays, each printed in quadruplicate, and wells are exposed to an analyte concentration series diluted into calf serum. C. Data is processed using our custom software suite, which includes the Protein Microarray Analysis Tool (ProMAT) to produce dose-response calibration curves and limit of detection analysis. The analysis plots the coefficient of variability (CV) for the replicate spots as a function of analyte concentration, demonstrating the concentration range within which the an assay performed upon a sample of unknown concentration would have predictive power. D. Example dose-response curve for the biomarker enzyme matrix metalloproteinase 1 (MMP1), demonstrating a sigmoidal dependence between fluorescence output and MMP1 concentration. Limits of detection are determined at the concentration at which the signal can no longer be differentiated from zero concentration.
Figure 2
Figure 2
A. Photonic crystal device structure fabricated on a low autofluorescence quartz substrate by nanoimprint lithography. The structure is comprised of a low refractive index quartz substrate with a periodic array of linear grooves, with a period of 400 nm. The quartz grating is overcoated with a thin film of TiO2 to generate a photonic crystal with optical resonances at desired wavelengths. B. SEM photo of a fabricated PC surface. C. Photo of an entire 1×3 in2 microscope slide populated with a PC surface.
Figure 3
Figure 3
A. Evanescent field profile (simulated by rigorous coupled wave analysis) of a PC surface illuminated at the resonant condition, demonstrating an electric field magnitude magnitude that is greater than the magnitude of the electric field supplied by a plane wave illumination source incident from below. To represent the power associated with the evanescent field, the squared magnitude of the electric field is plotted (in units of (V/m)2, and the illumination source has a magnitude of unity. B. Signal-to-noise ratio (SNR) for detection of fluorophore-tagged poly-phe-lysine (PPL) spots applied to a PC surface or a glass surface, as a function of PPL/dye concentration, demonstrating that compared to performing detection of the same material on a glass surface, the PC provides up to three orders of magnitude greater fluorescent signal. Here, the PC is demonstrated to reduce limits of detection by over two orders of magnitude using a custom detection instrument that supplies collimated illumination at the angle of resonant coupling. Used with permission from A. Pokhriyal, et al., Optics Express, Vol. 18, No. 24, p. 24793–24808, 2010.
Figure 4
Figure 4
A. Confocal laser-scanned microarray images of Cy5 labeled protein microarray spots on a PC and glass surface after exposure to 20 cytokines, demonstrating that the PC increases with fluorescent signal for a microspot ELISA assay. B. Comparison of fluorescence intensity on PC surface and a glass surface for simultaneous detection of 15 biomarkers, demonstrating that signal-to-noise is increased for every assay in the array. C. Dose/response characterization for one of the biomarkers within the array – Tumor Necrosis Factor Alpha (TNFα) comparing a glass surface (green) to a PC surface (blue). Used with permission from C.-S. Huang et al., Analytical Chemistry, Vol. 83, No. 4, p. 1425–1430, 2011.
Figure 4
Figure 4
A. Confocal laser-scanned microarray images of Cy5 labeled protein microarray spots on a PC and glass surface after exposure to 20 cytokines, demonstrating that the PC increases with fluorescent signal for a microspot ELISA assay. B. Comparison of fluorescence intensity on PC surface and a glass surface for simultaneous detection of 15 biomarkers, demonstrating that signal-to-noise is increased for every assay in the array. C. Dose/response characterization for one of the biomarkers within the array – Tumor Necrosis Factor Alpha (TNFα) comparing a glass surface (green) to a PC surface (blue). Used with permission from C.-S. Huang et al., Analytical Chemistry, Vol. 83, No. 4, p. 1425–1430, 2011.
Figure 5
Figure 5
Multiplexed detection of several biomarkers in buffer using a PC surface and antibody capture spots applied by DPN. A. Image of ~30 μm diameter assay spots in 5x replicates after Cy5 tagging for a positive control (application of dye-labeled antibody) and several biomarkers, with five replicate spots per assay. B. Dose/response curves for a biomarker assay comprised of simultaneous detection of 10 analytes. C. Limits of detection for each assay.
Figure 6
Figure 6
Example increase in detection sensitivity and reduction in CV obtained using an array scanning approach using multiple incident angles of illumination to optimize laser coupling to the PC despite variability in capture spot density. A). Fluorescence of a TNFα microspot ELISA obtained by illumination at a fixed angle of 10 degrees. B). Fluorescent image of the same assay using the angle scan method in which multiple images are gathered for a range of incident laser angles, and the peak intensity is selected for each pixel. C). Corresponding dose/response data with error bars representing one standard deviation of 9 replicate spots per concentration. Used with permission from Chaudhery et al., Optics Letters, 2012.

References

    1. Anderson NL. The roles of multiple proteomic platforms in a pipeline for new diagnostics. Molecular and Cellular Proteomics. 2005;4:1441–1444. - PubMed
    1. Robinson WH, DiGennaro C, Hueber W, Haab BB, Kamachi M, Dean EJ, Fournel S, Fong D, Genovese MC, NdVegvar HE, Skriner K, Hirschberg DL, Morris RI, Muller S, Prujin GJ, Venrooij WJv, Smolen JS, Brown PO, Steinman S, Utz PJ. Autoantigen microarrays for multiplex characterization of autoantibody responses. Nature Medicine. 2002;8:295–301. - PubMed
    1. Fan R, Vermesh O, Srivastava A, Yen BKH, Qin LD, Ahmad H, Kwong GA, Liu CC, Gould J, Hood L, Heath JR. Integrated barcode chips for rapid, multiplexed analysis of proteins in microliter quantities of blood. Nature Biotechnology. 2008 Dec;26:1373–1378. - PMC - PubMed
    1. Leitch AM. Controversies in breast cancer screening. Cancer. 1995;76:2064–2069. - PubMed
    1. Ciatto S, Rosselli DT, Zappa M. The detectability of breast cancer by screening mammography. Br J Cancer. 1995;71:337–339. - PMC - PubMed

Publication types

MeSH terms

Substances