. 2012 Sep;31(9):1821-32.
doi: 10.1109/TMI.2012.2205586. Epub 2012 Jun 21.

Comb-push ultrasound shear elastography (CUSE): a novel method for two-dimensional shear elasticity imaging of soft tissues

Affiliations

Comb-push ultrasound shear elastography (CUSE): a novel method for two-dimensional shear elasticity imaging of soft tissues

Pengfei Song et al. IEEE Trans Med Imaging. 2012 Sep.

Abstract

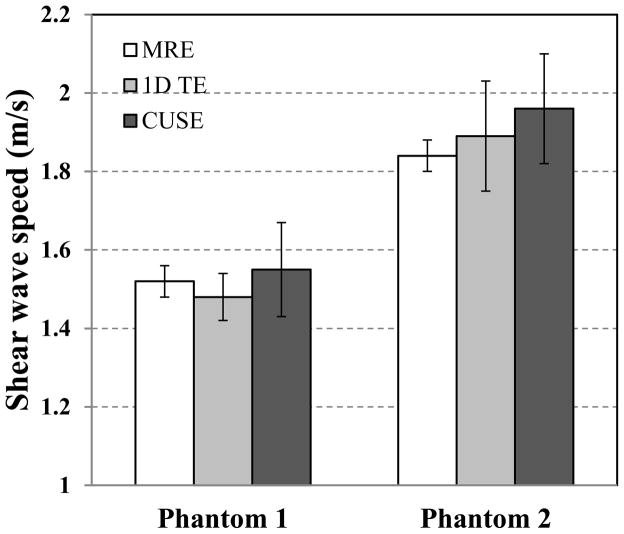
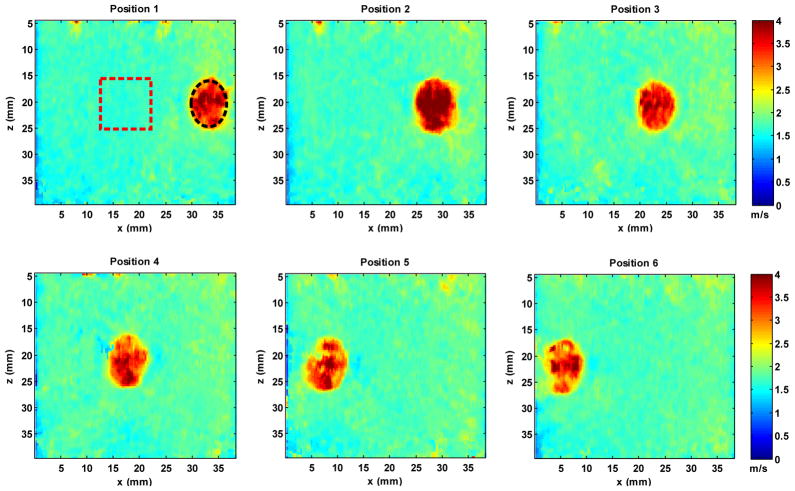
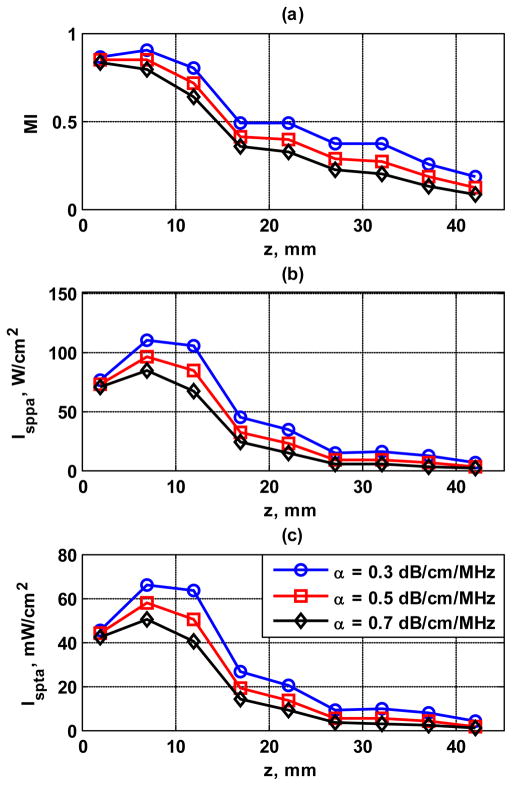
Fast and accurate tissue elasticity imaging is essential in studying dynamic tissue mechanical properties. Various ultrasound shear elasticity imaging techniques have been developed in the last two decades. However, to reconstruct a full field-of-view 2-D shear elasticity map, multiple data acquisitions are typically required. In this paper, a novel shear elasticity imaging technique, comb-push ultrasound shear elastography (CUSE), is introduced in which only one rapid data acquisition (less than 35 ms) is needed to reconstruct a full field-of-view 2-D shear wave speed map (40 × 38 mm). Multiple unfocused ultrasound beams arranged in a comb pattern (comb-push) are used to generate shear waves. A directional filter is then applied upon the shear wave field to extract the left-to-right (LR) and right-to-left (RL) propagating shear waves. Local shear wave speed is recovered using a time-of-flight method based on both LR and RL waves. Finally, a 2-D shear wave speed map is reconstructed by combining the LR and RL speed maps. Smooth and accurate shear wave speed maps are reconstructed using the proposed CUSE method in two calibrated homogeneous phantoms with different moduli. Inclusion phantom experiments demonstrate that CUSE is capable of providing good contrast (contrast-to-noise ratio ≥ 25 dB) between the inclusion and background without artifacts and is insensitive to inclusion positions. Safety measurements demonstrate that all regulated parameters of the ultrasound output level used in CUSE sequence are well below the FDA limits for diagnostic ultrasound.


Figures

Figure 1
Figure 1
Schematic plot of CUSE imaging sequence. (a) Comb-push is formed by transmitting unfocused push beams from subgroups 1, 3, 5, 7, and 9 (12 elements in each subgroup) simultaneously, while subgroups 2, 4, 6, and 8 (17 elements in each subgroup) are turned off. (b) All transducer elements are used in plane wave imaging mode for shear wave motion detection
Figure 2
Figure 2
Field II simulation of the acoustic radiation force field produced by comb-push. (a) Normalized intensity in x-z view for attenuation of 0.5 dB/cm/MHz. (b) Normalized intensity in y-z view for attenuation of 0.5 dB/cm/MHz. (c) Normalized intensity in x-z view for attenuation of 0.7 dB/cm/MHz. (d) Normalized intensity in y-z view for attenuation of 0.7 dB/cm/MHz.
Figure 3
Figure 3
Normalized acoustic intensity field of the comb-push beams. (a) x-z plane, (b) y-z plane. The color scale is the same for both figures.
Figure 4
Figure 4
Plots of particle axial velocity at different time steps. The shear waves constructively and destructively interfere with each other until all shear waves have passed through the FOV (only part of the shear wave propagation plots are shown here for succinctness). The black arrows indicate the left-to-right propagating shear wave front from the leftmost tooth (subgroup 1) of the comb-push. The color-bar is in unit of mm/s and is different for each time point. (a) initial positions of shear waves produced by 5 teeth, black arrow is at the shear wave front from subgroup 1 of the comb-push, (b) shear waves from each push beam begin to propagate away from the push beam on opposite directions, the right-propagating shear wave from subgroup 1 was pointed by the black arrow, (c) the right-propagating shear wave from subgroup 1 merged with the left-propagating shear wave from subgroup 3, (d) the right-propagating shear wave from subgroup 1 merged with the left-propagating shear wave from subgroup 5, (e) the right-propagating shear wave from subgroup 1 merged with the left-propagating shear wave from subgroup 7, (f) the right-propagating shear wave from subgroup 1 merged with the left-propagating shear wave from subgroup 9.
Figure 5
Figure 5
Particle axial velocity plots along slow-time and lateral dimensions before and after directional filtering. (a) Before directional filtering, the complex shear wave field with constructive and destructive shear wave interference can be observed. (b) LR shear waves extracted by directional filter. All shear waves are propagating from left to right and no destructive interference with RL waves can be observed. (c) RL shear waves extracted by directional filter. Again all destrutive shear wave interferences have been removed.
Figure 6
Figure 6
Schematic plots of 2D shear wave speed map reconstruction. (a) Shear wave speed map reconstructed using LR waves, (b) shear wave speed map reconstructed using RL waves, (c) final shear wave speed map combined by Recon1 and Recon2. Subgroup 1 area is recovered from Recon2, subgroup 9 area is recovered from Recon1, while the area in the middle is recovered from averaging Recon1 and Recon2.
Figure 7
Figure 7
Shear wave dispersion analysis for phantom 1 and phantom 2. Shear wave speeds at different frequencies were measured using two-dimensional Fourier analysis.
Figure 8
Figure 8
Maximum measured pressure waveform for the unfocused beam (derated with 0.3 dB/cm/MHz to the depth of 7 mm where the maximum pressure located in water).
Figure 9
Figure 9
2D shear wave speed maps from two CIRS phantoms with different moduli. (a), shear wave speed map of phantom 1, the red rectangle indicates the measuring ROI, (b) shear wave speed map of phantom 2, the measuring ROI is the same as in (a).
Figure 10
Figure 10
Shear wave speed of phantom1 and phantom2 measured by MRE, 1D TE and CUSE. Error bars are plotted from 95% confidence interval (CI).
Figure 11
Figure 11
A CIRS breast elastography phantom was imaged using CUSE. The ultrasound transducer was mounted on a mechanical stage. By translating the transducer, the inspected inclusion will change its relative position to the transducer.
Figure 12
Figure 12
Reconstructed 2D shear wave speed maps for the CIRS breast elastography phantom at different lateral positions (from Position 1 to Position 6). All shear wave speed maps are under the same color scale. For each position, a black circular ROI within the inclusion and a red rectangular ROI in the background were drawn to estimate shear wave speed, as shown in the plot of Position 1. Similar ROIs were selected for the rest positions.
Figure 13
Figure 13
Acoustic output results for different levels of deration (0.3, 0.5, 0.7 dB/cm/MHz). (a) MI, (b) ISPPA, (c) ISPTA.

References

    1. Greenleaf JF, Fatemi M, Insana M. Selected methods for imaging elastic properties of biological tissues. Annual review of biomedical engineering. 2003;5:57–78. - PubMed
    1. Yamakoshi Y, Sato J, Sato T. Ultrasonic imaging of internal vibration of soft tissue under forced vibration. IEEE transactions on ultrasonics, ferroelectrics, and frequency control. 1990;37:45–53. - PubMed
    1. Fatemi M, Greenleaf JF. Ultrasound-stimulated vibro-acoustic spectrography. Science. 1998 Apr 3;280:82–5. - PubMed
    1. Sarvazyan AP, Rudenko OV, Swanson SD, Fowlkes JB, Emelianov SY. Shear wave elasticity imaging: a new ultrasonic technology of medical diagnostics. Ultrasound in medicine & biology. 1998 Nov;24:1419–35. - PubMed
    1. Nightingale KR, Palmeri ML, Nightingale RW, Trahey GE. On the feasibility of remote palpation using acoustic radiation force. The Journal of the Acoustical Society of America. 2001 Jul;110:625–34. - PubMed

Publication types

MeSH terms