

Contribution of microRNA-1275 to Claudin11 protein suppression via a polycomb-mediated silencing mechanism in human glioma stem-like cells
- PMID: 22736761
- PMCID: PMC3431641
- DOI: 10.1074/jbc.M112.359109
Contribution of microRNA-1275 to Claudin11 protein suppression via a polycomb-mediated silencing mechanism in human glioma stem-like cells
Abstract
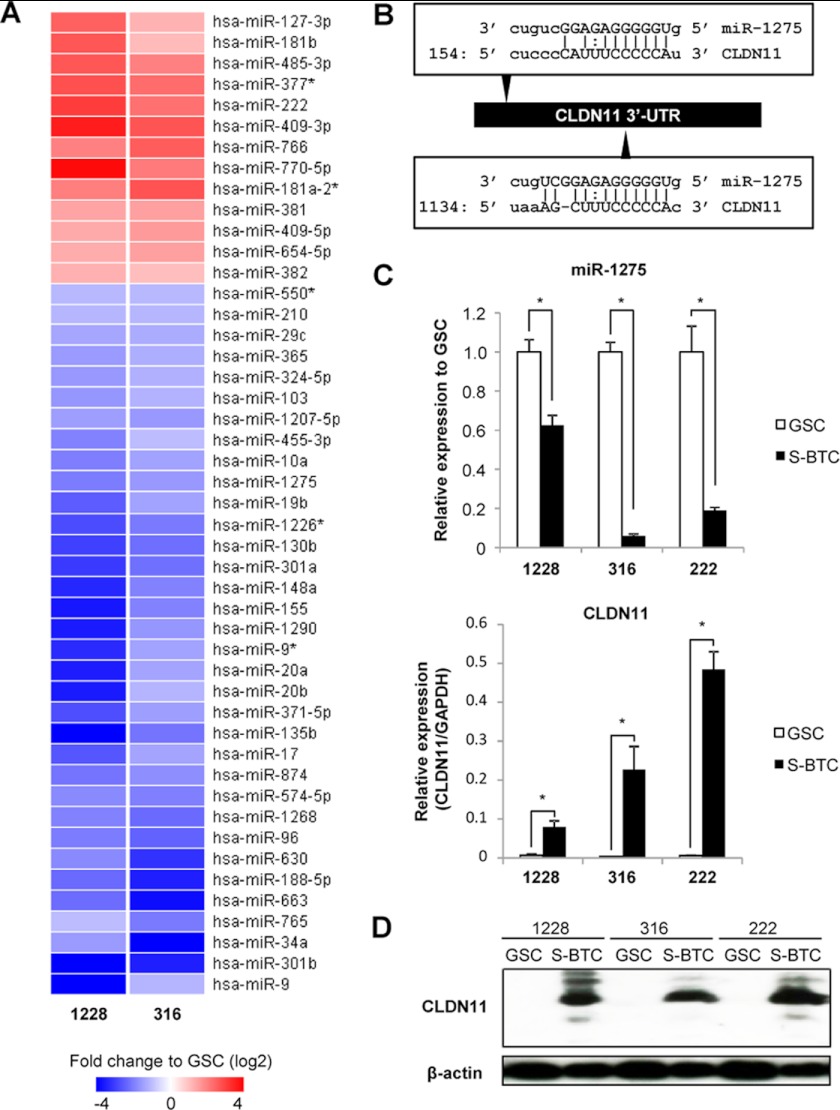
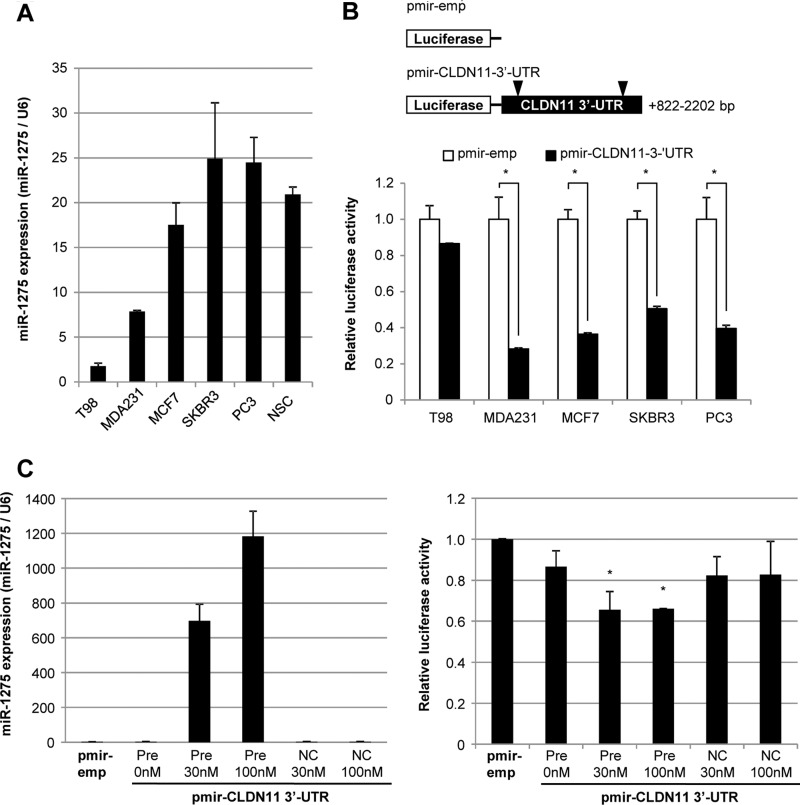
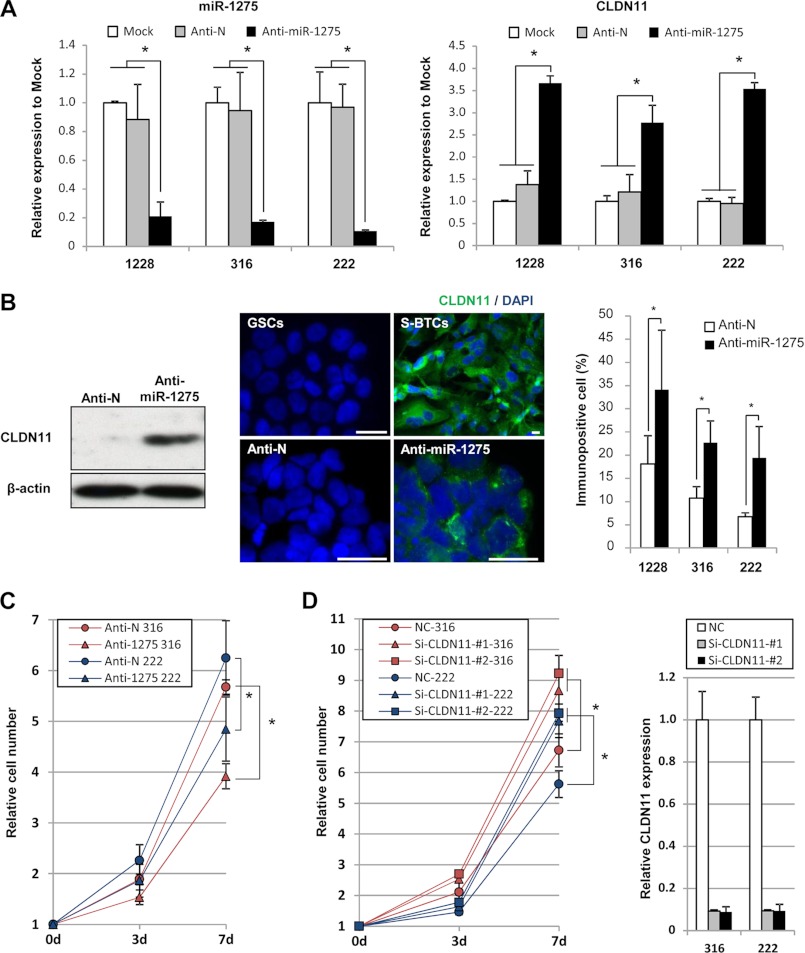
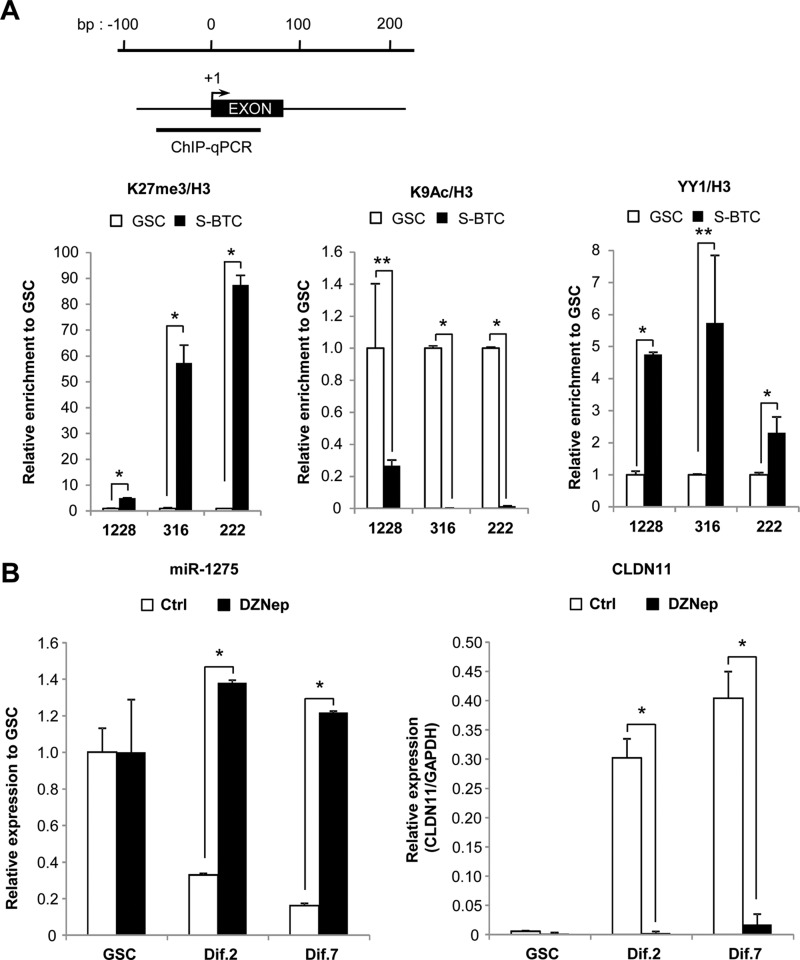
Glioblastomas show heterogeneous histological features, and tumor cells show distinct phenotypic states that confer different functional attributes and an aggressive character. However, the molecular mechanisms underlying the heterogeneity in this disease are poorly understood. Glioma stem-like cells (GSCs) are considered able to aberrantly differentiate into diverse cell types and may contribute to the establishment of tumor heterogeneity. Using a GSC model, we investigated differentially expressed microRNAs (miRNAs) and associated epigenetic mechanisms that regulate the differentiation of GSCs. miRNA profiling using microarray technology showed that 13 and 34 miRNAs were commonly up-regulated and down-regulated in two independent GSC lines during differentiation, respectively. Among this set of miRNAs, quantitative PCR analysis showed that miRNA-1275 (miR-1275) was consistently down-regulated during GSC differentiation, along with the up-regulation of its target, CLDN11, an important protein during oligodendroglial lineage differentiation. Inhibition of miR-1275 with a specific antisense oligonucleotide (anti-miR-1275) in GSCs increased the expression of CLDN11, together with significant growth suppression. Epigenetic analysis revealed that gain of histone H3 lysine 27 trimethylation (H3K27me3) in the primary microRNA-1275 promoter was closely associated with miR-1275 expression. Treatment with 3-deazaneplanocin A, an inhibitor of H3K27 methyltransferase, attenuated CLDN11 induction by serum stimulation in parallel with sustained miR-1275 expression. Our results have illuminated the epigenetic regulatory pathways of miR-1275 that are closely associated with oligodendroglial differentiation, which may contribute to the tissue heterogeneity seen in the formation of glioblastomas. Given that inhibition of miR-1275 induces expression of oligodendroglial lineage proteins and suppresses tumor cell proliferation, this may be a potential therapeutic target for glioblastomas.
Figures

Similar articles
-
MicroRNA-30a suppresses self-renewal and tumorigenicity of glioma stem cells by blocking the NT5E-dependent Akt signaling pathway.FASEB J. 2020 Apr;34(4):5128-5143. doi: 10.1096/fj.201802629RR. Epub 2020 Feb 17. FASEB J. 2020. PMID: 32067282
-
MicroRNA-137 is downregulated in glioblastoma and inhibits the stemness of glioma stem cells by targeting RTVP-1.Oncotarget. 2013 May;4(5):665-76. doi: 10.18632/oncotarget.928. Oncotarget. 2013. PMID: 23714687 Free PMC article.
-
Targeting glioma stem cells by functional inhibition of a prosurvival oncomiR-138 in malignant gliomas.Cell Rep. 2012 Sep 27;2(3):591-602. doi: 10.1016/j.celrep.2012.07.012. Epub 2012 Aug 24. Cell Rep. 2012. PMID: 22921398 Clinical Trial.
-
Non-coding RNAs as epigenetic regulator of glioma stem-like cell differentiation.Front Genet. 2014 Feb 3;5:14. doi: 10.3389/fgene.2014.00014. eCollection 2014. Front Genet. 2014. PMID: 24550934 Free PMC article. Review.
-
New advances of microRNAs in glioma stem cells, with special emphasis on aberrant methylation of microRNAs.J Cell Physiol. 2014 Sep;229(9):1141-7. doi: 10.1002/jcp.24540. J Cell Physiol. 2014. PMID: 24374932 Review.
Cited by
-
MicroRNA-1275 suppresses cell growth, and retards G1/S transition in human nasopharyngeal carcinoma by down-regulation of HOXB5.J Cell Commun Signal. 2016 Dec;10(4):305-314. doi: 10.1007/s12079-016-0351-9. Epub 2016 Sep 20. J Cell Commun Signal. 2016. PMID: 27644407 Free PMC article.
-
Exploring and exploiting the fundamental role of microRNAs in tumor pathogenesis.Onco Targets Ther. 2013 Nov 18;6:1675-84. doi: 10.2147/OTT.S52730. eCollection 2013. Onco Targets Ther. 2013. PMID: 24273410 Free PMC article. Review.
-
Curcumin inhibits angiogenesis by up-regulation of microRNA-1275 and microRNA-1246: a promising therapy for treatment of corneal neovascularization.Cell Prolif. 2016 Dec;49(6):751-762. doi: 10.1111/cpr.12289. Epub 2016 Sep 14. Cell Prolif. 2016. PMID: 27625050 Free PMC article.
-
Multi-species transcriptome meta-analysis of the response to retinoic acid in vertebrates and comparative analysis of the effects of retinol and retinoic acid on gene expression in LMH cells.BMC Genomics. 2021 Mar 2;22(1):146. doi: 10.1186/s12864-021-07451-2. BMC Genomics. 2021. PMID: 33653267 Free PMC article.
-
Causal network perturbations for instance-specific analysis of single cell and disease samples.Bioinformatics. 2020 Apr 15;36(8):2515-2521. doi: 10.1093/bioinformatics/btz949. Bioinformatics. 2020. PMID: 31873725 Free PMC article.
References
-
- Phillips H. S., Kharbanda S., Chen R., Forrest W. F., Soriano R. H., Wu T. D., Misra A., Nigro J. M., Colman H., Soroceanu L., Williams P. M., Modrusan Z., Feuerstein B. G., Aldape K. (2006) Molecular subclasses of high-grade glioma predict prognosis, delineate a pattern of disease progression, and resemble stages in neurogenesis. Cancer Cell 9, 157–173 - PubMed
-
- Singh S. K., Hawkins C., Clarke I. D., Squire J. A., Bayani J., Hide T., Henkelman R. M., Cusimano M. D., Dirks P. B. (2004) Identification of human brain tumor initiating cells. Nature 432, 396–401 - PubMed
-
- Lee J., Kotliarova S., Kotliarov Y., Li A., Su Q., Donin N. M., Pastorino S., Purow B. W., Christopher N., Zhang W., Park J. K., Fine H. A. (2006) Tumor stem cells derived from glioblastomas cultured in bFGF and EGF more closely mirror the phenotype and genotype of primary tumors than do serum-cultured cell lines. Cancer Cell 9, 391–403 - PubMed
-
- Gupta P. B., Chaffer C. L., Weinberg R. A. (2009) Cancer stem cells: mirage or reality? Nat. Med. 15, 1010–1012 - PubMed
Publication types
MeSH terms
Substances
LinkOut - more resources
Full Text Sources
Other Literature Sources
Molecular Biology Databases
Research Materials
