. 2012 Aug 24;287(35):29442-56.
doi: 10.1074/jbc.M112.378901. Epub 2012 Jun 26.

Mammalian alteration/deficiency in activation 3 (Ada3) is essential for embryonic development and cell cycle progression

Affiliations

Mammalian alteration/deficiency in activation 3 (Ada3) is essential for embryonic development and cell cycle progression

Shakur Mohibi et al. J Biol Chem. .

Abstract

Ada3 protein is an essential component of histone acetyl transferase containing coactivator complexes conserved from yeast to human. We show here that germline deletion of Ada3 in mouse is embryonic lethal, and adenovirus-Cre mediated conditional deletion of Ada3 in Ada3(FL/FL) mouse embryonic fibroblasts leads to a severe proliferation defect which was rescued by ectopic expression of human Ada3. A delay in G(1) to S phase of cell cycle was also seen that was due to accumulation of Cdk inhibitor p27 which was an indirect effect of c-myc gene transcription control by Ada3. We further showed that this defect could be partially reverted by knocking down p27. Additionally, drastic changes in global histone acetylation and changes in global gene expression were observed in microarray analyses upon loss of Ada3. Lastly, formation of abnormal nuclei, mitotic defects and delay in G(2)/M to G(1) transition was seen in Ada3 deleted cells. Taken together, we provide evidence for a critical role of Ada3 in embryogenesis and cell cycle progression as an essential component of HAT complex.


Figures

FIGURE 1.
FIGURE 1.
Ablation of Ada3 causes proliferation defect in MEFs. A, growth curves of Ada3FL/FL (left) and Ada3FL/FL/fhAda3 (right) MEFs after control adenovirus (Ctrl)or Cre adenovirus (Cre) infection. Data are mean ± S.E. from three independent experiments performed in triplicates. B, Ada3 protein levels at different time points after Cre adenovirus infection. Note that reconstituted control cells express both mouse (mAda3; lower band) and human (FLAG hAda3; upper band) proteins, whereas only hAda3 is seen in Cre adenovirus-infected cells. C, colony formation assay. Crystal violet staining of the indicated cells infected with control virus or Cre adenovirus grown for 10 days is shown. D, Western blotting of lysates from C showing exogenous and endogenous Ada3.
FIGURE 2.
FIGURE 2.
Ada3 disruption delays G1 to S transition in MEFs. A, control (Ctrl)- or Cre- infected Ada3FL/FL MEFs were serum-starved for 72 h and then released from synchrony as described under “Experimental Procedures” and processed for PI staining followed by FACS analysis. Cells in different phases of the cell cycle are shown from a representative experiment. B, graph derived from three independent experiments performed as in A, showing the proportion of cells entering into S phase at the indicated times after serum restimulation. Error bars are mean ± S.E. from three independent experiments (**, p = 0.0096, two-tailed Student's t test).
FIGURE 3.
FIGURE 3.
Effect of Ada3 depletion on expression of cell cycle regulator proteins and Cdk2 kinase activity. A, Ada3FL/FL MEFs infected with control (Ctrl) and Cre adenoviruses serum-starved for 72 h, released from synchrony as described under “Experimental Procedures,” and processed for immunoblot analysis of the indicated cell cycle proteins. hyper, hyperphosphorylated; hypo, hypophosphorylated. B, anti-Cdk2 or anti-Cdk4/6 immunoprecipitations performed using 300-μg extracts of Ada3FL/FL MEFs infected with control or Cre adenovirus were subjected to in vitro kinase assay using histone H1 or Rb as a substrate. WB, Western blot; IP, immunoprecipitation.
FIGURE 4.
FIGURE 4.
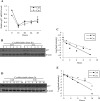
Deletion of Ada3 does not affect p27 transcription but extends p27 protein half-life. A, unaltered p27 mRNA levels after Ada3 deletion. Real-time RT-PCR analysis of p27 mRNA levels from cells as treated in Fig. 2 was performed. Signals were normalized to β-actin levels and plotted relative to the level of p27 mRNA in starved control (Ctrl) cells. Error bars show mean ± S.E. from three independent experiments. B–E, Ada3 deletion in MEFs extends p27 half-life. B, 48 h after adenovirus infection, MEFs were treated with 50 μg/ml cycloheximide and harvested at the indicated time points, and p27 and β-actin protein levels were analyzed by immunoblotting. C, the intensity of p27 bands was quantified by densitometry, normalized to β-actin using ImageJ software, and plotted against the time of cycloheximide treatment. Each decrease of 1 unit of log 2 is equivalent to one half-life. The lines were generated by linear regression formula. D, after 48 h of adenovirus infection, MEFs were starved using 0.1% serum-containing medium for 72 h and subsequently treated with 50 μg/ml cycloheximide and harvested at the indicated time points. Cell lysates were analyzed by Western blotting using antibodies against p27 and β-actin. E, graph made from experiment in D by using the same procedure as in C.
FIGURE 5.
FIGURE 5.
p27 depletion partially rescues G1 to S transition defects seen in Ada3-null MEFs. A, Ada3FL/FL MEFs were infected with retrovirus-expressing scrambled or p27 shRNA followed by selection for 2 days in puromycin and analyzed by immunoblotting using p27 and β-actin antibodies. B, PI staining and FACS analysis of Ada3FL/FL MEFs expressing p27 shRNA that were infected with either control (Ctrl) or Cre adenoviruses and synchronized as in Fig. 2. C, graph derived from three experiments as in B showing the proportion of cells entering into S phase at the indicated times after serum restimulation. Error bars indicate mean ± S.E. from three independent experiments. D, immunoblotting of protein samples from B showing rescue of hyperphosphorylated (hyper) Rb and cyclin A levels. hypo, hypophosphorylated.
FIGURE 6.
FIGURE 6.
Deletion of Ada3 from MEFs leads to reduced mRNA and protein levels of Skp2 and c-Myc. A, analysis of Skp2 mRNA levels by real-time RT-PCR from cells as treated in Fig. 2. Signals were normalized to β-actin levels and plotted relative to the level of Skp2 mRNA in starved control cells. Error bars represent mean ± S.E. from three independent experiments (*, p = 0.015, 0.036, 0.043, and 0.032 for 16, 20, 24, and 28 h, respectively by two-tailed Student's t test). B, immunoblots showing Skp2 protein levels in cells treated as in A. C, analysis of c-Myc mRNA levels by real-time RT-PCR from cells as treated in Fig. 5. Signals were normalized to β-actin levels and plotted as in A. Error bars show mean ± S.E. from three independent experiments. D, immunoblots showing c-Myc protein levels in cells treated as in C (*, p = 0.023 and 0.027 for 1 and 3 h, respectively; **, p = 0.008 by two-tailed Student's t test). E, occupancy of Ada3 on the c-myc enhancer. Chromatin fragments from control (Ctrl) and Cre Ada3FL/FL MEFs cells were immunoprecipitated with anti-Ada3 antibody. Chromatin fragments were prepared from Asynchronous (Asyn.) cells as well as from cells synchronized with 0.1% serum containing DMEM for 72 h (lane 0) and stimulated with serum with indicated time points. The immunoprecipitated DNA was analyzed by PCR, using c-Myc enhancer-specific primers. Primers amplifying a region that is 5 kb upstream of the c-Myc enhancer were used as a negative control. RNA Pol II, RNA polymerase II.
FIGURE 7.
FIGURE 7.
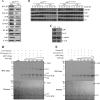
Ada3 deletion abrogates histone acetylation by destabilizing various HATs. A–C, Western blotting analysis of lysates from asynchronous (A and C) or serum-restimulated (B) Ada3FL/FL or Ada3FL/FL/fhAda3 MEFs infected with control (Ctrl) or Cre adenoviruses using the indicated antibodies. D and E, Ada3 enhances p300 HAT activity. In vitro HAT assay using purified recombinant human Ada3 and core histones (D) or histone H3 alone (E) along with their respective Ponceau blots to indicate equal loading is shown.
FIGURE 8.
FIGURE 8.
Abnormal cell division and delayed G2/M to G1 transition in Ada3-deleted cells. A, images of Ada3FL/FL cells after 5 days of infection with Cre adenovirus showing abnormal (fragmented, lobulated, or multi) nuclei. B, quantification of abnormal nuclei from cells infected with control (Ctrl) or Cre adenovirus; 5 days after infection, cells were fixed and stained with Giemsa stain and scored for abnormal nuclei (at least 100 cells from each group were counted). Error bars show mean ± S.E. from three independent experiments. C, control- and Cre adenovirus-infected MEFs were treated for 20 h with nocodazole and were harvested at the indicated time points after release, stained with PI, and subjected to FACS analysis. D, graph showing the percentage of cells entering G1 phase after release from nocodazole treatment at various time points from experiments as in C. Error bars are mean ± S.E. from three independent experiments (*, p = 0.034; **, p = 0.0038 and 0.007 for 4 and 8 h, respectively, by two tailed Student's t test).
FIGURE 9.
FIGURE 9.
Proposed model for the role of Ada3 in cell cycle progression. As a core structural component of various HAT complexes, Ada3 maintains the integrity of HAT complexes and thus regulates global histone acetylation. Ada3 regulates G1 to S transition by controlling transcription of c-myc gene, which in turn controls Skp2 gene expression by binding to its promoter. Skp2 as an E3 ubiquitin ligase causes timely degradation of p27 protein so that cells can enter into S phase by increasing Cdk2 kinase activity, thus inducing hyperphosphorylation of Rb and cell progression from G1 to S phase of cell cycle. Additionally, through controlling global histone acetylation, Ada3 controls transcription of various genes involved in cell division and is required for cells to undergo normal mitosis and G2/M to G1 progression.

Similar articles

Cited by

References

    1. Schafer K. A. (1998) The cell cycle: a review. Vet. Pathol 35, 461–478 - PubMed
    1. Li B., Carey M., Workman J. L. (2007) The role of chromatin during transcription. Cell 128, 707–719 - PubMed
    1. Luger K., Mäder A. W., Richmond R. K., Sargent D. F., Richmond T. J. (1997) Crystal structure of the nucleosome core particle at 2.8 Å resolution. Nature 389, 251–260 - PubMed
    1. Kouzarides T. (2007) Chromatin modifications and their function. Cell 128, 693–705 - PubMed
    1. Strahl B. D., Allis C. D. (2000) The language of covalent histone modifications. Nature 403, 41–45 - PubMed

Publication types

MeSH terms