. 2012 Aug;18(8):1435-45.
doi: 10.1261/rna.033621.112. Epub 2012 Jun 26.

SplicerEX: a tool for the automated detection and classification of mRNA changes from conventional and splice-sensitive microarray expression data

Affiliations

SplicerEX: a tool for the automated detection and classification of mRNA changes from conventional and splice-sensitive microarray expression data

Timothy J Robinson et al. RNA. 2012 Aug.

Abstract

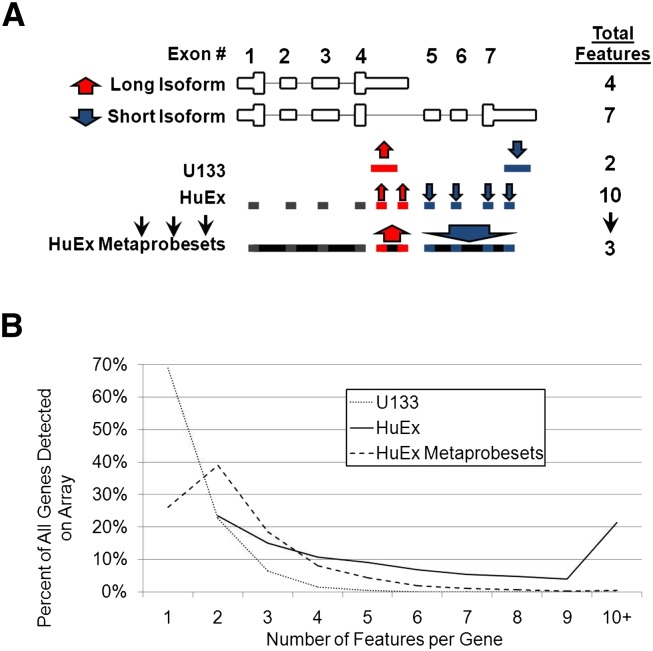
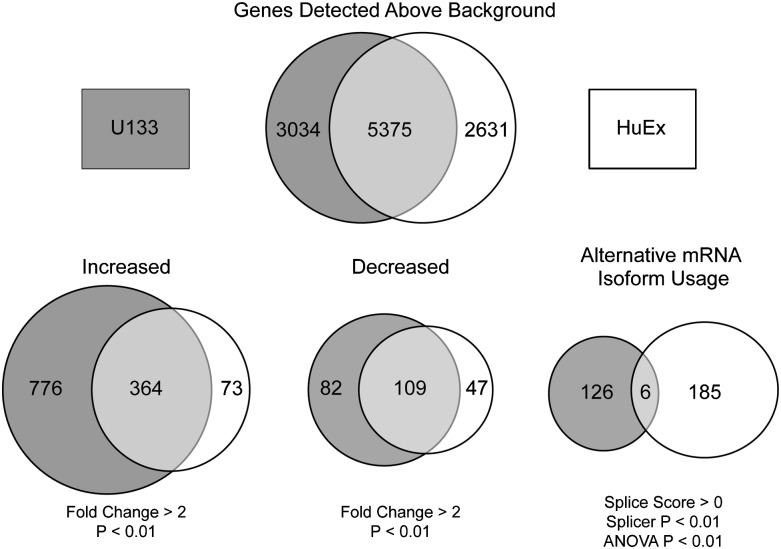
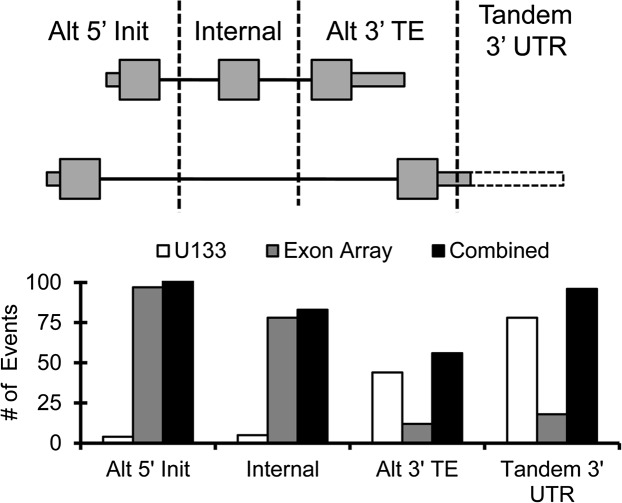
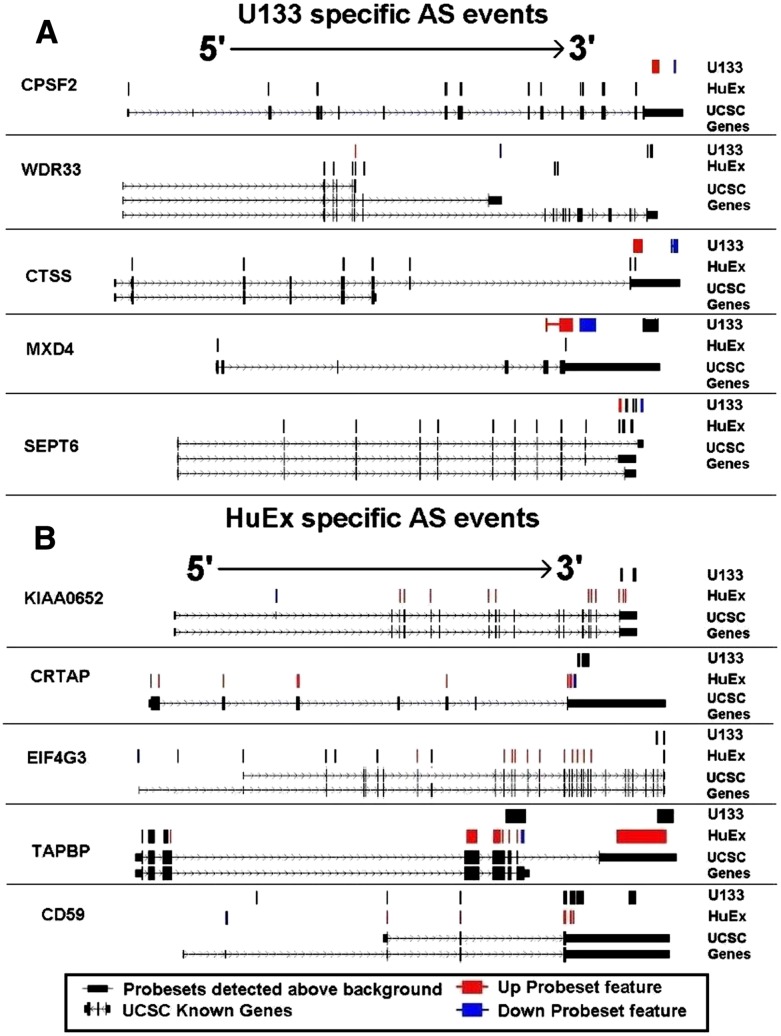
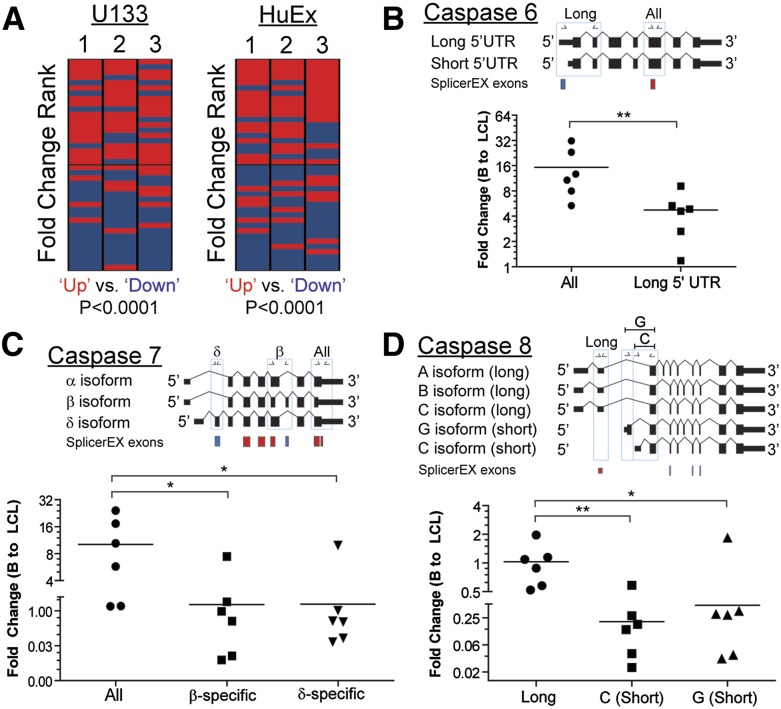
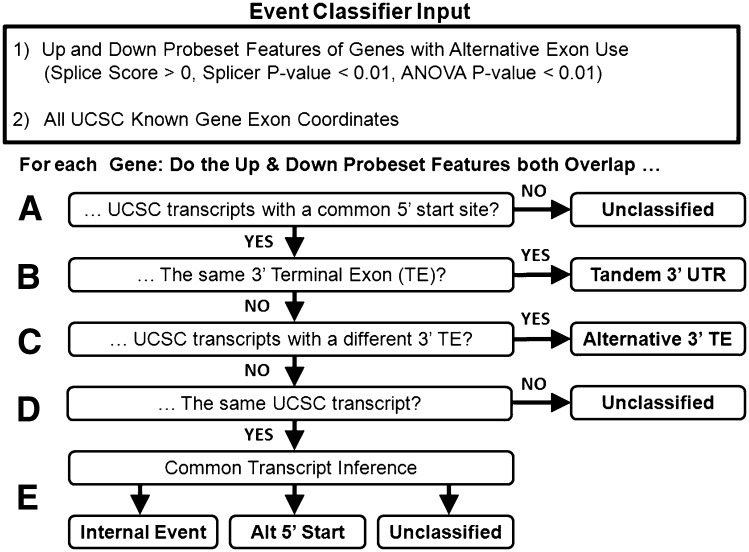
The key postulate that one gene encodes one protein has been overhauled with the discovery that one gene can generate multiple RNA transcripts through alternative mRNA processing. In this study, we describe SplicerEX, a novel and uniquely motivated algorithm designed for experimental biologists that (1) detects widespread changes in mRNA isoforms from both conventional and splice sensitive microarray data, (2) automatically categorizes mechanistic changes in mRNA processing, and (3) mitigates known technological artifacts of exon array-based detection of alternative splicing resulting from 5' and 3' signal attenuation, background detection limits, and saturation of probe set signal intensity. In this study, we used SplicerEX to compare conventional and exon-based Affymetrix microarray data in a model of EBV transformation of primary human B cells. We demonstrated superior detection of 3'-located changes in mRNA processing by the Affymetrix U133 GeneChip relative to the Human Exon Array. SplicerEX-identified exon-level changes in the EBV infection model were confirmed by RT-PCR and revealed a novel set of EBV-regulated mRNA isoform changes in caspases 6, 7, and 8. Finally, SplicerEX as compared with MiDAS analysis of publicly available microarray data provided more efficiently categorized mRNA isoform changes with a significantly higher proportion of hits supported by previously annotated alternative processing events. Therefore, SplicerEX provides an important tool for the biologist interested in studying changes in mRNA isoform usage from conventional or splice-sensitive microarray platforms, especially considering the expansive amount of archival microarray data generated over the past decade. SplicerEX is freely available upon request.


Figures

FIGURE 1.
FIGURE 1.
SplicerEX application of meta-probe sets to human exon (HuEx) arrays. (A) Diagram comparing interrogation by 3′ IVT (i.e., U133) versus HuEx microarrays of a hypothetical gene undergoing alternative 3′-terminal exon choice. U133 arrays possess fewer probe sets per gene than the HuEx array and preferentially target 3′ UTRs of known mRNA transcripts. Collapsing exon array probe sets into meta-probe sets on the basis of correlated expression patterns reduces the number of features per gene to a level similar to 3′-IVT arrays. SplicerEX then identifies the two most divergently expressed features within a gene (red and blue) to locate and characterize structural changes in mRNA isoforms. (B) Number of features per gene for the conventional U133, HuEx (Exon Array), and HuEx meta-probe set–preprocessed microarray data. Collapsing exon array features on the basis of correlated expression patterns reduces the number of exon array features per gene to a level similar to that of the U133 array, permitting analysis of both array platforms by a single algorithm.
FIGURE 2.
FIGURE 2.
U133 and HuEx arrays detect nonoverlapping changes in alternative mRNA processing. Comparison of genes detected, increased, decreased, and alternatively processed by array platform. Comparisons of increased, decreased, and alternatively processed gene lists were limited to genes detected on both the U133 and HuEx platforms. Genes were considered to be differentially expressed with p < 0.01 and fold change >2 between LCL (treatment) versus B-cell (reference) samples. Genes were considered to be alternatively processed if they had a positive splice score, SplicerEX p-val <0.01, and ANOVA p-val <0.01.
FIGURE 3.
FIGURE 3.
HuEx and U133 arrays detect spatially distinct mRNA isoform changes. Comparison of SplicerEX-predicted mRNA isoform changes detected using the U133 versus HuEx array platforms. Alternative 5′-transcript initiation and internal events were preferentially detected by the HuEx array. Internal events were primarily composed of cassette exons, but could also include intron retention and alternative 5′- or 3′-exon definition. Alternative 3′-TE choice and tandem 3′ UTRs were preferentially detected by the U133 array. Alternative 3′-TE choice occurred via alternative polyadenylation or alternative 3′-splice site selection. Tandem 3′ UTRs universally resulted in shortening or lengthening of mRNA 3′-UTR length.
FIGURE 4.
FIGURE 4.
Alternative mRNA isoform changes detected by only either U133 (A) or HuEx (B) platforms. Five of the top alternative isoform usage changes detected by SplicerEX on each platform were examined by plotting the genomic location of all probe sets that overlapped known UCSC gene transcript exons. All such probe sets detected above background are shown above the corresponding known UCSC gene transcripts. The most significant increasing meta-probe set (“UP feature”) (red); the most significant decreasing meta-probe set (“DOWN feature”) (blue); all remaining probe sets (black). U133 specific events (A) were more often located in the 3′-UTR region, where HuEx probe sets were unable to detect transcripts. HuEx-specific events (B) were more often 5′ and internally located, and were not interrogated by U133 probe sets.
FIGURE 5.
FIGURE 5.
Quantitative RT-PCR validation of SplicerEX-predicted U133 and HuEx mRNA isoform changes. (A) The heatmaps display the fold-change rank order (from top to bottom) of 40 qRT-PCR reactions (20 “Up” and 20 “Down” for each gene) on each platform (U133 on left and HuEx on right) for three independent donors. Each reaction measures the fold change of mRNA between B cell and LCL for either the Up event (red) or the Down events (blue). If all Up reactions were ranked above the Down reactions, then the heatmap would be red on the top half and blue on the bottom half. The P-value shown is from the Mann-Whitney U-test, which was used to compare the set of Up reactions to the set of Down reactions. (B) A schematic diagram is shown for two caspase 6 mRNA isoforms predicted based on our SplicerEX data. The primer locations for qRT-PCR are indicated above, and SplicerEX meta-probe sets are displayed below (Up exons [red]; Down exons [blue]). Below the schematic is a graph plotting the fold change from B to LCL for qRT-PCR reactions characterizing the isoform change in six independent human donors. (**) p < 0.01 (Mann-Whitney). (C) As in B, a schematic diagram of caspase 7 mRNA isoforms is shown including primers for qRT-PCR and SplicerEX meta-probe sets. The graph indicates B-to-LCL fold-change values for reactions characterizing all isoforms, β-specific isoforms, or δ-specific isoforms. (*) p < 0.05 (Mann-Whitney). (D) As in B and C, a schematic diagram of caspase 8 mRNA isoforms is shown including primers and SplicerEX meta-probe sets. The graph plots B-to-LCL fold-change values for reactions characterizing long, C (short)–specific, and G (short)–specific isoforms. (*) p < 0.05; (**) p < 0.01 (Mann-Whitney).
FIGURE 6.
FIGURE 6.
SplicerEX decision tree used to categorize alternative mRNA processing events into discrete categories. SplicerEX assigned mechanistic categories of mRNA isoform changes by comparing the location of the two primary distinguishing probe set features (probe sets for the U133 array and meta-probe sets for the HuEx arrays) with known UCSC gene transcripts. The algorithm first removes a gene if either feature does not overlap a known UCSC transcript, resulting in an unclassified event. Second, the event is recorded as unclassified if neither feature overlaps transcripts with a common 5′ start site (A). If both features overlap the same 3′-terminal exon, then the event reflects a change in 3′-UTR length, indicating the presence of tandem 3′ UTRs (B). If each feature targets a different 3′ terminal exon, then the gene is categorized as undergoing alternative 3′ terminal exon choice (C). If the event has not been categorized at this point, but both features target at least one common UCSC transcript (D), then the event is categorized as an internal event, an alternative 5′ initiation event, or unclassified using the common transcript inference (CTI) algorithm (E) (Table 2).

Similar articles

Cited by

References

    1. Affymetrix. 2005. Alternative transcript analysis methods for exon arrays. Affymetrix Whitepaper 2005. http://www.affymetrix.com/support/technical/whitepapers.affx.
    1. Bemmo A, Benovoy D, Kwan T, Gaffney DJ, Jensen RV, Majewski J 2008. Gene expression and isoform variation analysis using Affymetrix Exon Arrays. BMC Genomics 9: 529 doi: 10.1186/1471-2164-9-529 - PMC - PubMed
    1. Blencowe BJ 2006. Alternative splicing: New insights from global analyses. Cell 126: 37–47 - PubMed
    1. Cahir-McFarland ED, Davidson DM, Schauer SL, Duong J, Kieff E 2000. NF-κB inhibition causes spontaneous apoptosis in Epstein–Barr virus-transformed lymphoblastoid cells. Proc Natl Acad Sci 97: 6055–6060 - PMC - PubMed
    1. Chang TY, Wu YH, Cheng CC, Wang HW 2011. Differentially regulated splice variants and systems biology analysis of Kaposi's sarcoma-associated herpesvirus-infected lymphatic endothelial cells. Nucleic Acids Res 39: 6970–6985 - PMC - PubMed

Publication types

MeSH terms