. 2012;8(6):e1002769.
doi: 10.1371/journal.ppat.1002769. Epub 2012 Jun 21.

Linking the transcriptional profiles and the physiological states of Mycobacterium tuberculosis during an extended intracellular infection

Affiliations

Linking the transcriptional profiles and the physiological states of Mycobacterium tuberculosis during an extended intracellular infection

Kyle H Rohde et al. PLoS Pathog. 2012.

Abstract

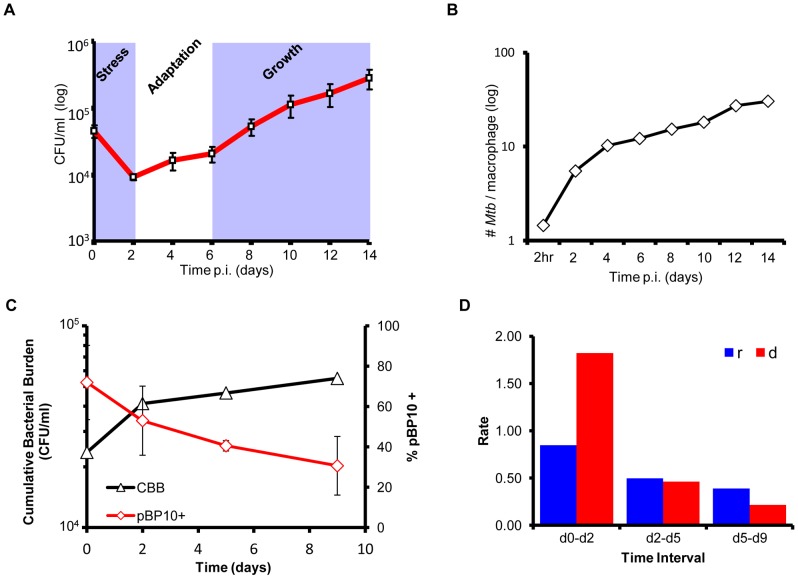
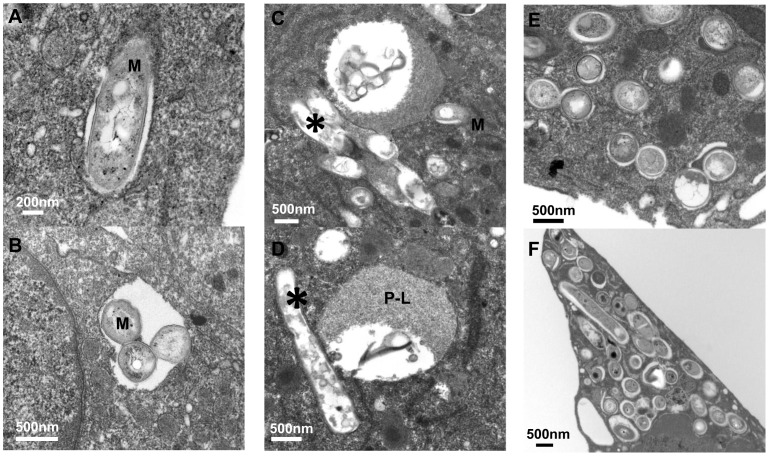
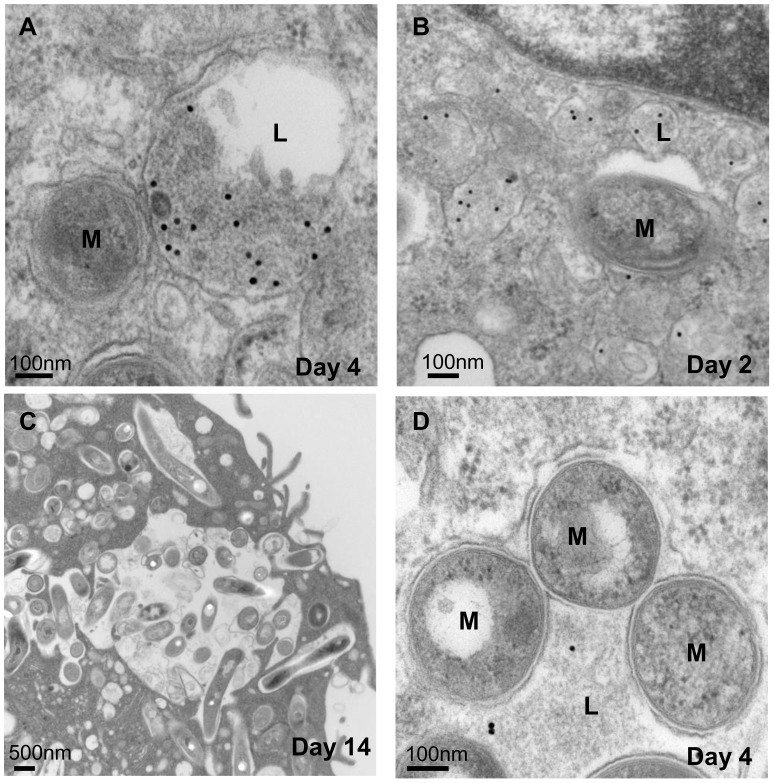
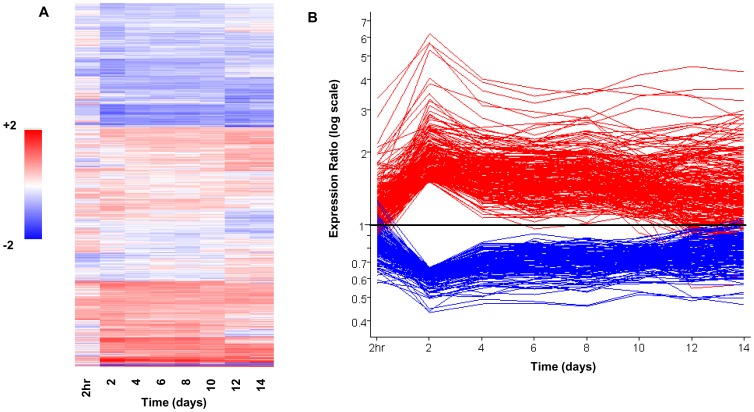
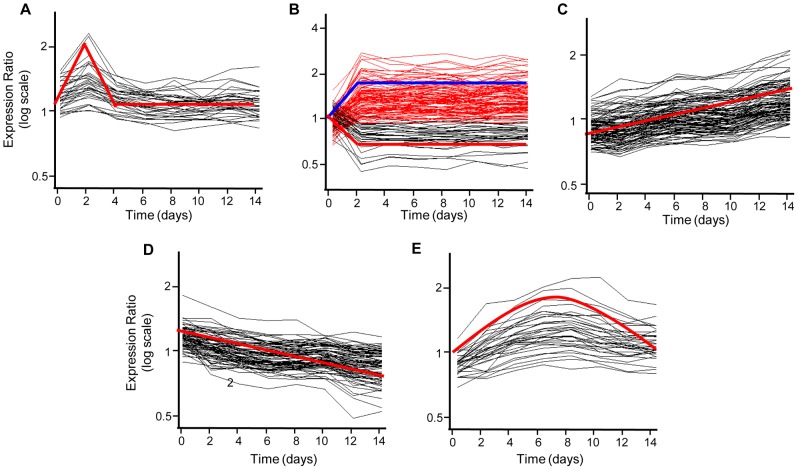
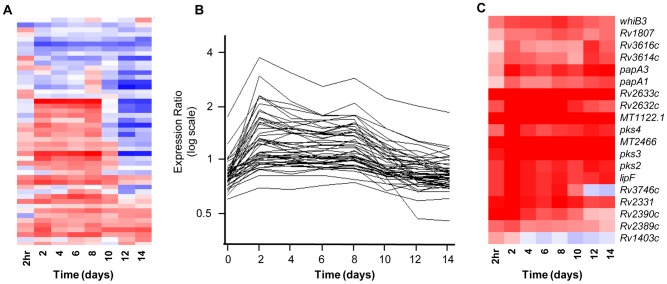
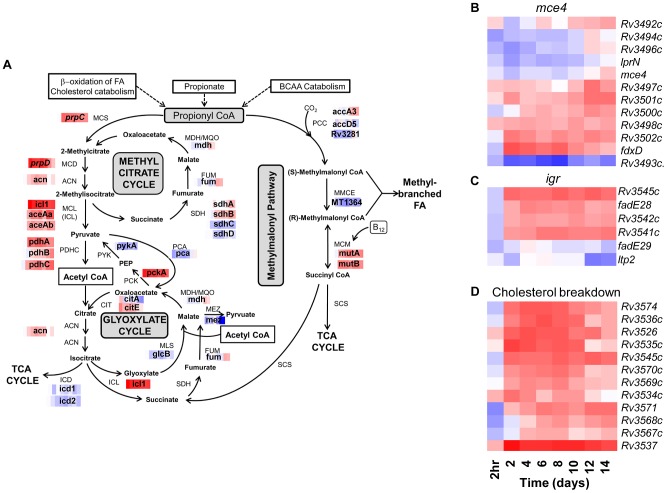
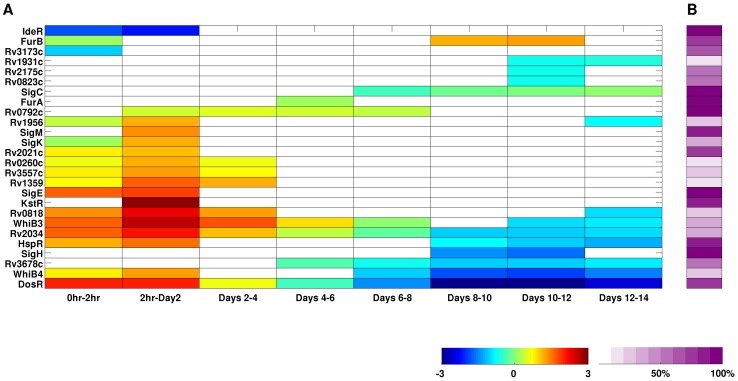
Intracellular pathogens such as Mycobacterium tuberculosis have evolved strategies for coping with the pressures encountered inside host cells. The ability to coordinate global gene expression in response to environmental and internal cues is one key to their success. Prolonged survival and replication within macrophages, a key virulence trait of M. tuberculosis, requires dynamic adaptation to diverse and changing conditions within its phagosomal niche. However, the physiological adaptations during the different phases of this infection process remain poorly understood. To address this knowledge gap, we have developed a multi-tiered approach to define the temporal patterns of gene expression in M. tuberculosis in a macrophage infection model that extends from infection, through intracellular adaptation, to the establishment of a productive infection. Using a clock plasmid to measure intracellular replication and death rates over a 14-day infection and electron microscopy to define bacterial integrity, we observed an initial period of rapid replication coupled with a high death rate. This was followed by period of slowed growth and enhanced intracellular survival, leading finally to an extended period of net growth. The transcriptional profiles of M. tuberculosis reflect these physiological transitions as the bacterium adapts to conditions within its host cell. Finally, analysis with a Transcriptional Regulatory Network model revealed linked genetic networks whereby M. tuberculosis coordinates global gene expression during intracellular survival. The integration of molecular and cellular biology together with transcriptional profiling and systems analysis offers unique insights into the host-driven responses of intracellular pathogens such as M. tuberculosis.


Conflict of interest statement

The authors have declared that no competing interests exist.

Figures

Figure 1
Figure 1. Life and death dynamics during long-term intracellular survival of Mtb.
(A) Survival Assays. Resting murine bone-marrow derived macrophages were infected at low MOI (∼1∶1) with Mtb CDC1551. Viable CFU were quantified at day 0 and at 2 day intervals p.i. over a 14-day time-course by lysis of monolayers, serial dilution, and plating on 7H10 medium. Error bars indicate standard error of the mean from two independent biological replicates each consisting of three technical replicates per strain (total of 6 wells/strain). (B) Quantitative EM. The intracellular bacterial load was determined by counting the number of Mtb (both morphologically normal and damaged bacilli) per macrophage (100 cells counted) in samples fixed at 2-day intervals p.i. from 0–14 days. (C) Replication Clock Plasmid. The percentage of bacteria containing the pBP10 plasmid during growth in resting macrophages was determined by comparing CFU (mean ± s.d.) recovered on kanamycin vs. nonselective media (red). The cumulative bacterial burden (CBB) (black) was determined by mathematical modeling based on total viable CFU and plasmid frequency data. Data shown represents two independent experiments with each sample performed in quadruplicate (8 total wells/time point). (D) Calculated growth (blue) and death (red) rates during phases of Mtb intracellular survival (per day during indicated intervals).
Figure 2
Figure 2. Electron microscopy analysis of long-term Mtb-macrophage interactions.
(A–B) Intracellular Mtb (indicated by “M”) 2 hr p.i., with individual bacilli occupying typical tight phagosomes (A) and clusters contained in loosely apposed spacious vacuoles (B). (C–D) Damaged and degraded Mtb (asterisk) associated with phagolysosomes (P-L) at 2 days p.i. (E–F) Macrophages with heavy bacterial burden at day 6 (E) and day 8 (F) p.i.
Figure 3
Figure 3. Mtb occupies heterogeneous intracellular niches.
(A) Mtb in tightly apposed phagosome resisting fusion with lysosome (L) loaded with colloidal gold (day 4 p.i.). (B) Mtb vacuole in the process of fusion with gold-containing lysosomes (day 2 p.i.). (C) Mixture of intact and damaged/degraded Mtb in single large lysosomes (day 14 p.i.). (D) Cluster of morphologically intact bacilli in gold-loaded lysosomes (day 4 p.i.).
Figure 4
Figure 4. Dynamic Mtb transcriptome during long-term macrophage infection.
(A) Gene tree of intracellular gene expression relative to 2 hr “no macrophage” control CDC1551 (two biological replicates of complete time-course). Expression profiles for 3626 genes passing quality filters (flagged as present in 14 of 16 arrays) and showing significant changes in gene expression were clustered using the Euclidean distance algorithm. Significantly regulated genes were defined by combining static (p<0.05 in at least one time point) and dynamic measures (q<0.03 by EDGE analysis). Each column represents the global transcription profile at the designated time p.i.. Red and blue indicate higher or lower gene expression than the control, respectively. Unless otherwise indicated, the color scale for expression (2-fold up or down) was used for all subsequent figures. (B) The “bottleneck” response. Temporal expression profiles of genes differentially regulated at Day 2 p.i., including genes from (A) that were up- (red) or down-regulated (blue) >1.5-fold (shown as ratio of signal intensity relative to control). Note the maximal change in transcript levels at day 2 p.i. followed by majority trending back towards control levels.
Figure 5
Figure 5. Profiles of Coordinated Temporal Gene Regulation.
(A–E) Clusters of temporally co-regulated genes were identified by correlation (>0.9) with synthetic profiles, indicated by red (A,B (down), C–E) or blue (B, up) lines. (A) Genes transiently induced at day 2, followed by return to control levels. B) Early induced (red) and repressed (black) genes with sustained altered transcript levels. Genes with steadily increasing (C) or decreased (D) expression levels. (E) Delayed induced genes.
Figure 6
Figure 6. The transcriptome as a bioprobe of the Mtb intracellular environment.
Gene trees of select signature genesets that are useful as surrogate readouts of the conditions encountered by Mtb within macrophages. (A) Hypoxia/RNI/CO. Genes of the well-characterized dosRS-dependent “dormancy” regulon indicate exposure of Mtb to known cues of this geneset (hypoxia, reactive nitrogen intermediates (RNI), and carbon monoxide (CO)). (B) “Guilt by association” analysis. Genes regulated in synch with known virulence regulons – i.e. the DosR regulon - were identified by using a highly regulated member of this regulon, hspX, in place of synthetic profiles. (C) Acid Stress. Select members of a regulon activated by acidic pH in vitro and within macrophage phagosomes report on the pH encountered by Mtb within its vacuole.
Figure 7
Figure 7. Adaptation of Carbon Metabolism during Extended Intracellular Growth.
Gene trees showing phagosomal induction of loci implicated in utilization of host-derived cholesterol as a carbon source. (A) Expression data from Mtb during a 14-day macrophage infection were superimposed onto a pathway map depicting propionyl-CoA metabolism adapted from Savvi et al. . The concerted induction of the methylcitrate cycle indicates activation of this pathway for detoxifying by-products of propionyl-CoA metabolism during macrophage survival. (B) mce4 is involved in the uptake of exogenous cholesterol , . The igr locus (C) and genes of the kstR regulon (D) are required for metabolism of cholesterol , .
Figure 8
Figure 8. Temporal network response during macrophage infection.
(A) Most of TF-controlled subnetworks represented in the TRN exhibit peaks of upregulation early in the infection followed by a repressive phase in later time points. The color scale indicates the overall direction of the transcriptional change within the subnetwork, from positive (+3) to negative (−3). (B) Percentage of regulatory links within the subnetwork based on experimental evidence.

Similar articles

Cited by

References

    1. de Chastellier C. The many niches and strategies used by pathogenic mycobacteria for survival within host macrophages. Immunobiology. 2009;214:526–542. - PubMed
    1. Deretic V, Delgado M, Vergne I, Master S, De Haro S, et al. Autophagy in immunity against mycobacterium tuberculosis: a model system to dissect immunological roles of autophagy. Curr Top Microbiol Immunol. 2009;335:169–188. - PMC - PubMed
    1. Roberts EA, Deretic V. The Mycobacterium tuberculosis phagosome. Methods Mol Biol. 2008;445:439–449. - PubMed
    1. Russell DG. Mycobacterium tuberculosis and the intimate discourse of a chronic infection. Immunol Rev. 2011;240:252–268. - PMC - PubMed
    1. Russell DG, VanderVen BC, Lee W, Abramovitch RB, Kim MJ, et al. Mycobacterium tuberculosis wears what it eats. Cell Host Microbe. 2010;8:68–76. - PMC - PubMed

Publication types

MeSH terms