. 2012;8(6):e1002774.
doi: 10.1371/journal.ppat.1002774. Epub 2012 Jun 21.

A highly intensified ART regimen induces long-term viral suppression and restriction of the viral reservoir in a simian AIDS model

Affiliations

A highly intensified ART regimen induces long-term viral suppression and restriction of the viral reservoir in a simian AIDS model

Iart Luca Shytaj et al. PLoS Pathog. 2012.

Abstract

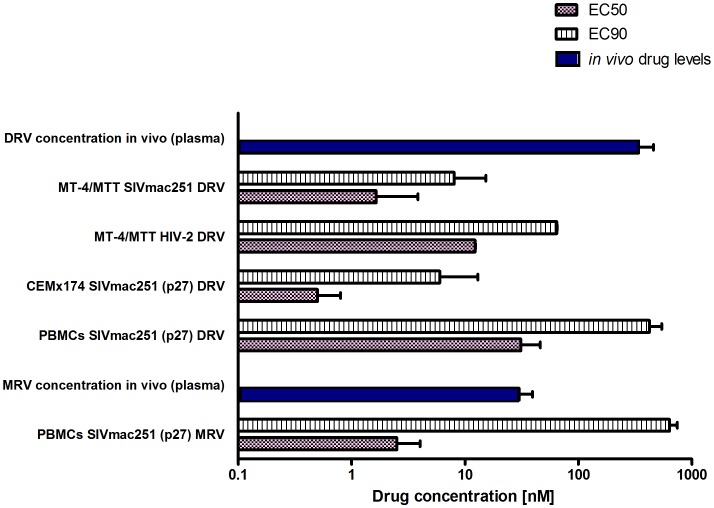
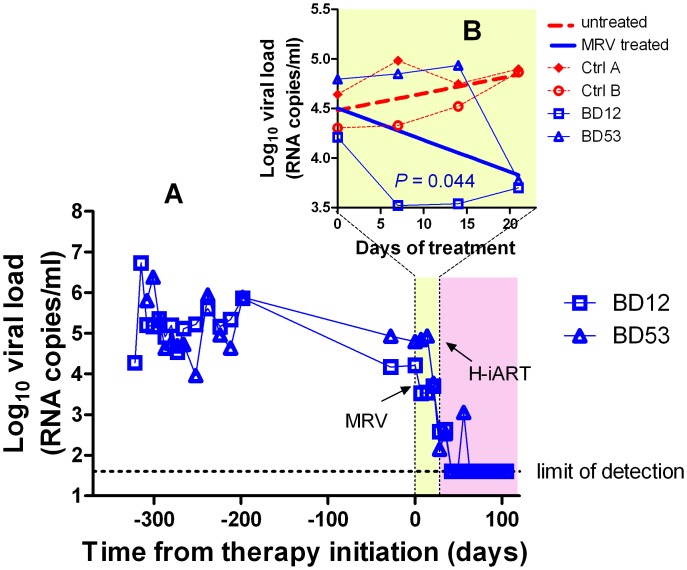
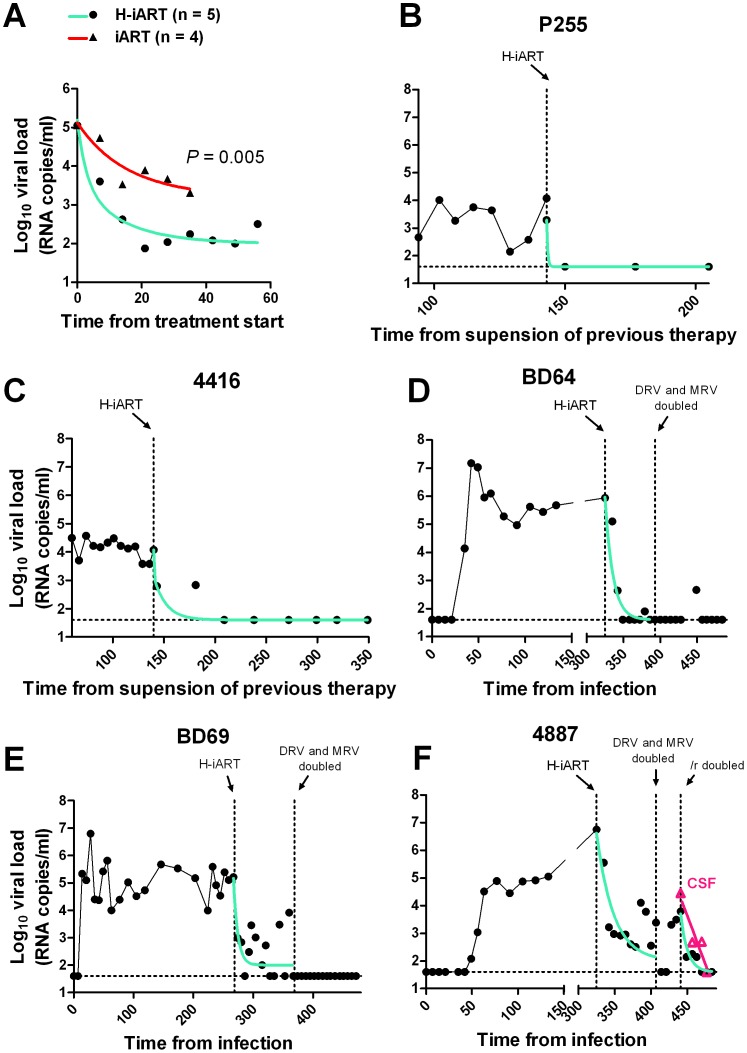
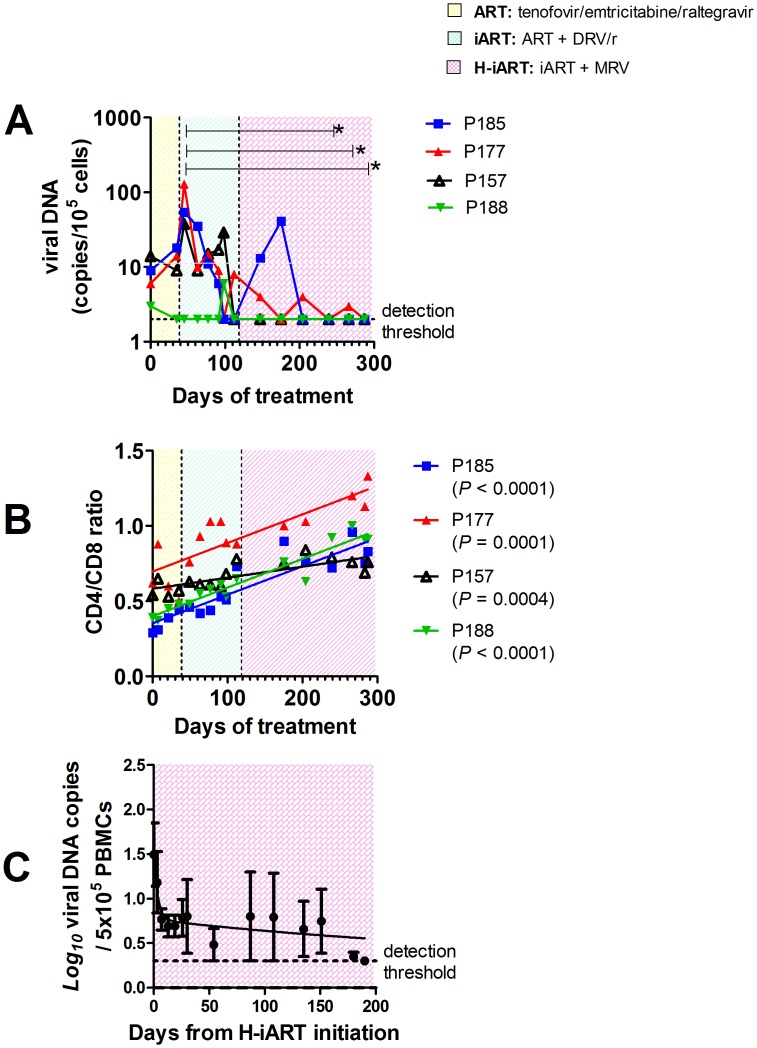
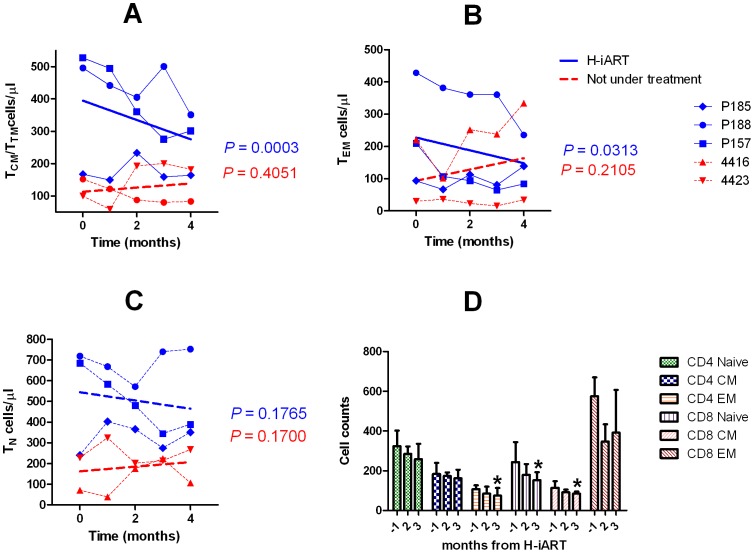
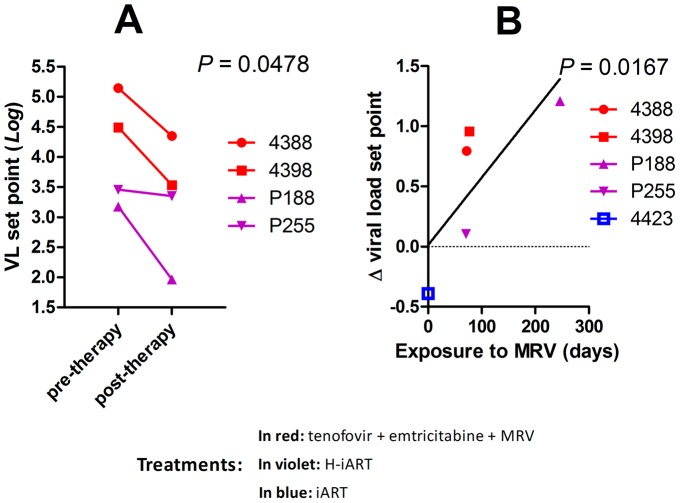
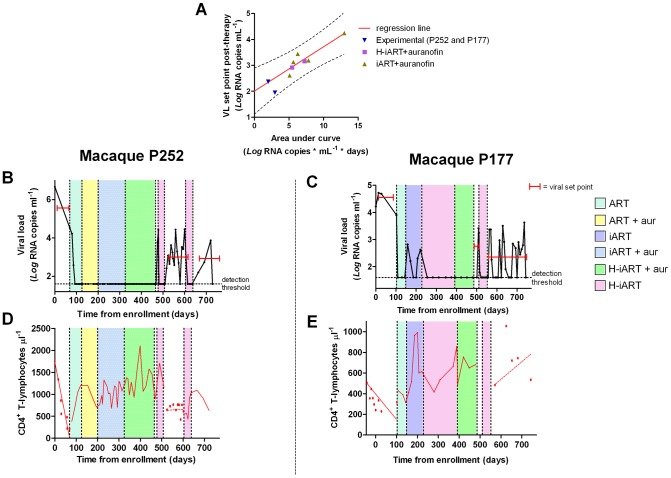
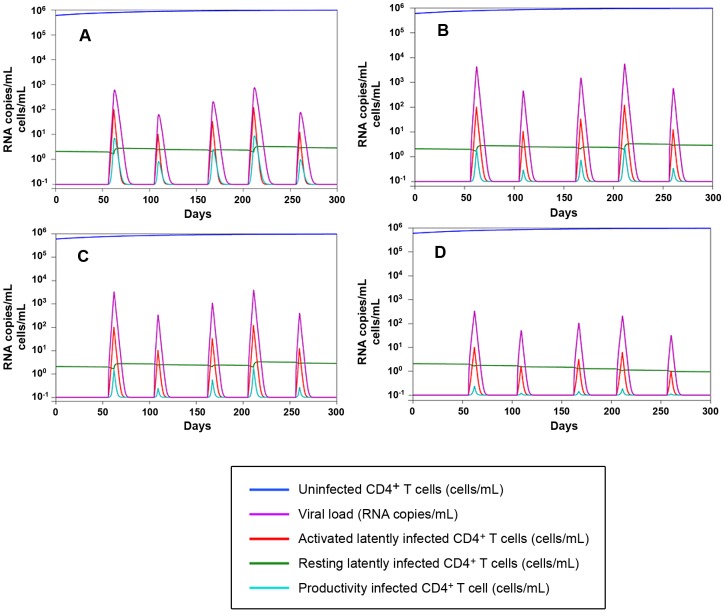
Stably suppressed viremia during ART is essential for establishing reliable simian models for HIV/AIDS. We tested the efficacy of a multidrug ART (highly intensified ART) in a wide range of viremic conditions (10³-10⁷) viral RNA copies/mL) in SIVmac251-infected rhesus macaques, and its impact on the viral reservoir. Eleven macaques in the pre-AIDS stage of the disease were treated with a multidrug combination (highly intensified ART) consisting of two nucleosidic/nucleotidic reverse transcriptase inhibitors (emtricitabine and tenofovir), an integrase inhibitor (raltegravir), a protease inhibitor (ritonavir-boosted darunavir) and the CCR5 blocker maraviroc. All animals stably displayed viral loads below the limit of detection of the assay (i.e. <40 RNA copies/mL) after starting highly intensified ART. By increasing the sensitivity of the assay to 3 RNA copies/mL, viral load was still below the limit of detection in all subjects tested. Importantly, viral DNA resulted below the assay detection limit (<2 copies of DNA/5*10⁵ cells) in PBMCs and rectal biopsies of all animals at the end of the follow-up, and in lymph node biopsies from the majority of the study subjects. Moreover, highly intensified ART decreased central/transitional memory, effector memory and activated (HLA-DR⁺) effector memory CD4⁺ T-cells in vivo, in line with the role of these subsets as the main cell subpopulations harbouring the virus. Finally, treatment with highly intensified ART at viral load rebound following suspension of a previous anti-reservoir therapy eventually improved the spontaneous containment of viral load following suspension of the second therapeutic cycle, thus leading to a persistent suppression of viremia in the absence of ART. In conclusion, we show, for the first time, complete suppression of viral load by highly intensified ART and a likely associated restriction of the viral reservoir in the macaque AIDS model, making it a useful platform for testing potential cures for AIDS.


Conflict of interest statement

The authors have declared that no competing interests exist.

Figures

Figure 1
Figure 1. SIVmac251 is susceptible to DRV and MRV.
Comparison between effective drug concentrations required for 50% and 90% inhibition of viral replication in vitro (respectively, EC50 and EC90) and the in vivo total levels (i.e. free and protein bound) of DRV and MRV in the plasma of six animals treated with H-iART. All values are displayed as mean + SEM.
Figure 2
Figure 2. Viro-immunological control of antiretrovirally treated macaques chronically infected with SIVmac251.
Panel A: Plasma viral loads. Panel B: CD4 counts. The sequential treatments are represented by the colored areas. Asterisks represent the significant differences from baseline values (respectively * P<0.05; ** P<0.01; *** P<0.001), as calculated by Bonferroni's test. The values corresponding to the different macaques, whose denominations are given in the legends, are shown by the different symbols and connecting lines. As a comparison, panel A shows the viral loads dynamics of two untreated macaques (olive).
Figure 3
Figure 3. Ritonavir-boosted MRV (MRV/r) is able to decrease viremia in vivo.
Panel A: Viral load measurements after infection and during treatment with MRV/r (light yellow) and H-iART (light purple). Panel B (detail): Viral loads during MRV/r monotherapy in comparison to viral loads of untreated controls.
Figure 4
Figure 4. Viral load decay dynamics under H-iART treatment.
Panel A: Comparison (two tailed t-test) of the antiretroviral efficacy of H-iART and iART. Viral loads are the mean values from 5 animals (H-iART) or 4 animals (iART). Two of the animals treated with iART are historical controls (for more detail see Table S1). The P-value was calculated by Aikaike's information criteria (AIC) for comparison of curves. Panels B, C, D, E, F: Nonlinear regression analysis (two phase decay) of viral load measurements during time. For macaque 4887, viral RNA levels in cerebrospinal fluid (CSF) are also shown (in magenta).
Figure 5
Figure 5. H-iART decreases viral DNA in PBMCs and increases the CD4/CD8 ratio.
Panel A: Viral DNA in PBMCs. Panel B: CD4/CD8 ratios. Both panels show the results from macaques enrolled in the pilot study. The sequential treatments are represented by the colored areas. In panel A, asterisks mark the significant differences from baseline values (P<0.05), as detected by Bonferroni's test. Panel C: Three-phase decay dynamics of total viral DNA of three macaques (BD69, 4416, P255) to which all H-iART drugs were administered simultaneously and for which viral DNA values from treatment initiation were available. Each time point represents average values (± SEM).
Figure 6
Figure 6. T-cell subpopulation dynamics during H-iART.
Panel A: CD4+ central and transitional memory T-cells (TCM/TTM) Panel B: CD4+ effector memory T-cells (TEM). Panel C: CD4+ naïve T-cells (TN). Panel D: HLA-DR+ T-cell subsets. In panels A–C, individual data points are presented for each animal. The significantly decreasing trends are shown by the solid regression lines. Dashed lines refer to non significant trends (P>0.05). In panel D, data are presented as means ± SEM from three animals and significantly decreasing trends are shown by the asterisks.
Figure 7
Figure 7. MRV decreases the post-therapy viral load set point.
Panel A: Pre and post therapy Log10 viral load set points of four SIVmac251 infected macaques treated with MRV-containing therapies. The P-value shown is the result of paired t-test analysis. Panel B: Correlation between the Log10 Δ viral load set point (i.e. the difference between pre and post therapy viral load set points) and time of exposure to MRV. Correlation was investigated using Pearson's coefficients. The treatment of macaques 4388 and 4398 prior to therapy suspension is shown in Figure S7 and Text S2.
Figure 8
Figure 8. A short cycle of H-iART at viral rebound after structured treatment interruption improves the effects of auranofin-based anti-reservoir therapies on the eventual viral load set point.
Panel A: Correlation between the area under the viral load curve at peak (AUC) following viral rebound and the eventual viral load set point. Panels B,C: Viral loads from infection of macaques subjected to the combined antireservoir/antiretroviral treatment protocol (see main text). The red bars mark the viral set points (calculated as the mean of the available Log10 viral load measurements). Panels D,E: CD4 counts. The values before and after the treatment periods are shown by the individual data points, and trends are described by the regression lines (solid: significant slopes; dashed: non significant slopes).
Figure 9
Figure 9. Numerical simulations of the Rong and Perelson model with programmed expansion and contraction of the viral reservoir.
Panel A: Simulation of the viral load and viral reservoir dynamics in a human model. The 300 days simulation is based on the five differential equations model (4) in , where burst size is assumed to be 2000 RNA copies/day. The peaks in the viral load (violet) correspond to the periods of activation of latently infected CD4+ T-cells. Proliferation rate and drug efficacy are assumed to be respectively 1.4 and 0.85. For starting data see Table S3. Panels B–D: Simulation of the viral load and viral reservoir dynamics infection in a macaque model. According to burst size is assumed to be 55000 RNA copies/day, which determines higher peaks in the viral load than in the previous human model. Panel B: proliferation rate = 1.4, drug efficacy = 0.95. Panel C: proliferation rate = 1.4, drug efficacy = 0.99. Panel D: proliferation rate = 0.945, drug efficacy = 0.99. The activation function adopted to simulate lymphocyte encounter with antigens is illustrated in Fig. S9 (for further detail, see Text S1).

References

    1. Norelli S, El Daker S, D'Ostilio D, Mele F, Mancini F, et al. Response of feline immunodeficiency virus (FIV) to tipranavir may provide new clues for development of broad-based inhibitors of retroviral proteases acting on drug-resistant HIV-1 Curr. HIV Res. 2008;6:306–17. - PubMed
    1. Witvrouw M, Pannecouque C, Switzer WM, Folks TM, De Clercq E, et al. Susceptibility of HIV-2, SIV and SHIV to various anti-HIV-1 compounds: implications for treatment and post exposure prophylaxis. Antivir Ther. 2004;9:57–65. - PubMed
    1. Deere JD, Schinazi RF, North TW. Simian immunodeficiency virus macaque models of HIV latency. Curr Opin HIV AIDS. 2011;6:57–61. - PMC - PubMed
    1. Dinoso JB, Rabi SA, Blankson JN, Gama L, Mankowski JL, et al. A simian immunodeficiency virus-infected macaque model to study viral reservoirs that persist during highly active antiretroviral therapy. J Virol. 2009;83:9247–9257. - PMC - PubMed
    1. Lewis MG, Norelli S, Collins M, Barreca ML, Iraci N, et al. Response of a simian immunodeficiency virus (SIVmac251) to raltegravir: a basis for a new treatment for simian AIDS and an animal model for studying lentiviral persistence during antiretroviral therapy. Retrovirology. 2010;7:21. - PMC - PubMed

Publication types

MeSH terms