

Geographic differences in genetic susceptibility to IgA nephropathy: GWAS replication study and geospatial risk analysis
- PMID: 22737082
- PMCID: PMC3380840
- DOI: 10.1371/journal.pgen.1002765
Geographic differences in genetic susceptibility to IgA nephropathy: GWAS replication study and geospatial risk analysis
Abstract
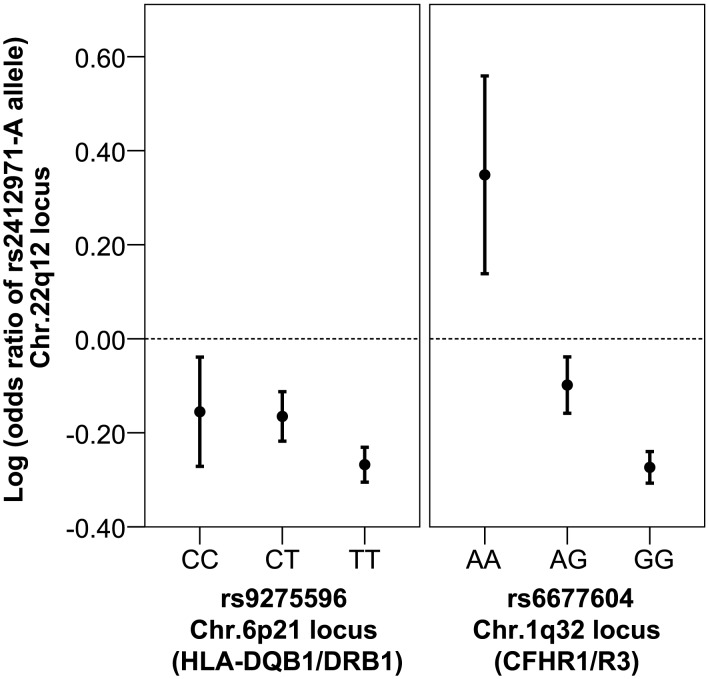
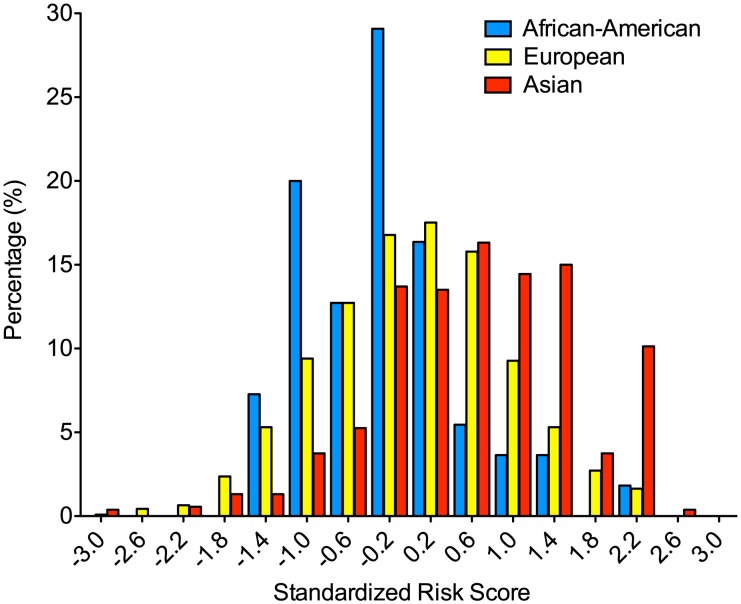
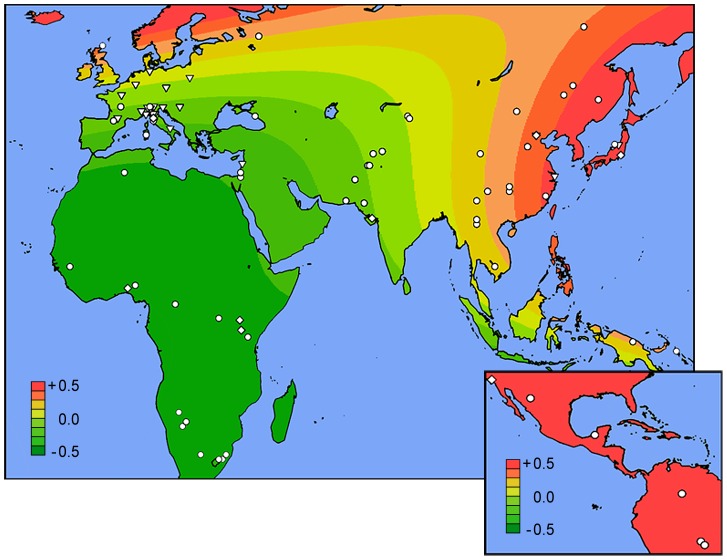
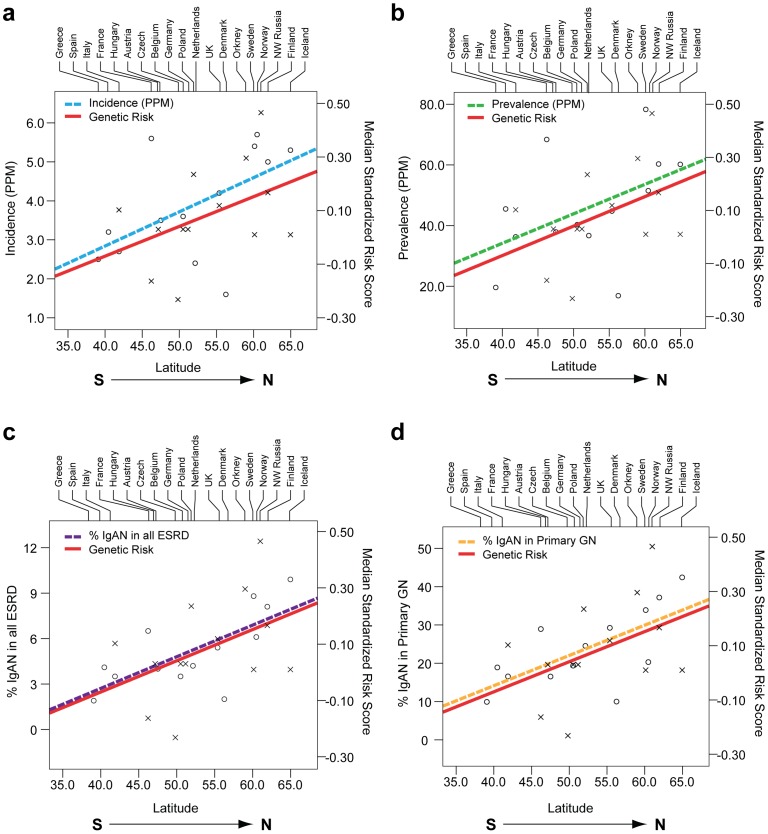
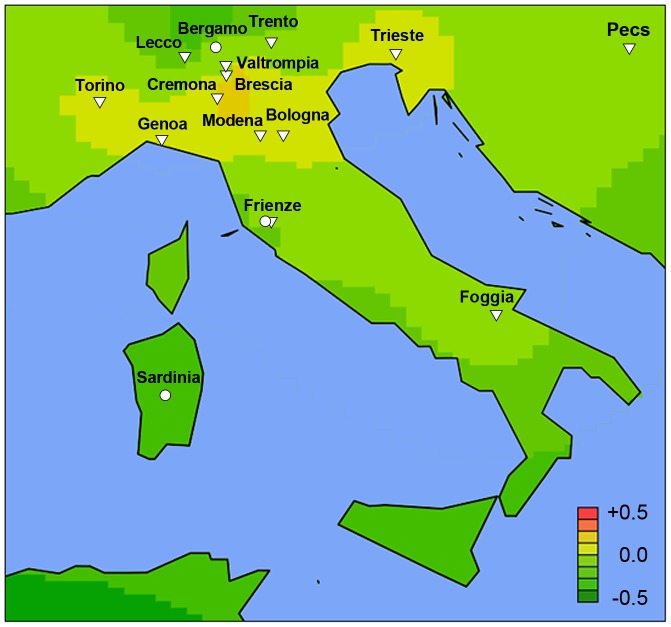
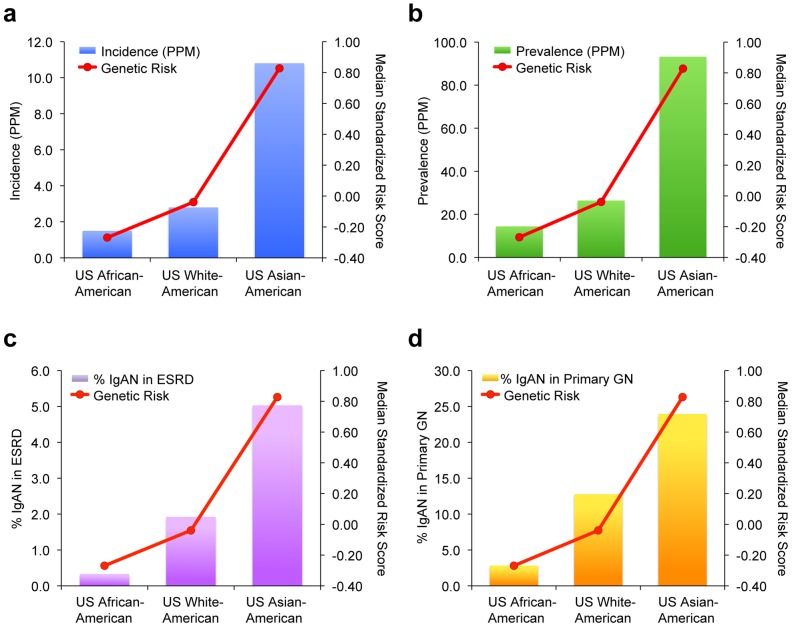
IgA nephropathy (IgAN), major cause of kidney failure worldwide, is common in Asians, moderately prevalent in Europeans, and rare in Africans. It is not known if these differences represent variation in genes, environment, or ascertainment. In a recent GWAS, we localized five IgAN susceptibility loci on Chr.6p21 (HLA-DQB1/DRB1, PSMB9/TAP1, and DPA1/DPB2 loci), Chr.1q32 (CFHR3/R1 locus), and Chr.22q12 (HORMAD2 locus). These IgAN loci are associated with risk of other immune-mediated disorders such as type I diabetes, multiple sclerosis, or inflammatory bowel disease. We tested association of these loci in eight new independent cohorts of Asian, European, and African-American ancestry (N = 4,789), followed by meta-analysis with risk-score modeling in 12 cohorts (N = 10,755) and geospatial analysis in 85 world populations. Four susceptibility loci robustly replicated and all five loci were genome-wide significant in the combined cohort (P = 5×10⁻³²-3×10⁻¹⁰), with heterogeneity detected only at the PSMB9/TAP1 locus (I² = 0.60). Conditional analyses identified two new independent risk alleles within the HLA-DQB1/DRB1 locus, defining multiple risk and protective haplotypes within this interval. We also detected a significant genetic interaction, whereby the odds ratio for the HORMAD2 protective allele was reversed in homozygotes for a CFHR3/R1 deletion (P = 2.5×10⁻⁴). A seven-SNP genetic risk score, which explained 4.7% of overall IgAN risk, increased sharply with Eastward and Northward distance from Africa (r = 0.30, P = 3×10⁻¹²⁸). This model paralleled the known East-West gradient in disease risk. Moreover, the prediction of a South-North axis was confirmed by registry data showing that the prevalence of IgAN-attributable kidney failure is increased in Northern Europe, similar to multiple sclerosis and type I diabetes. Variation at IgAN susceptibility loci correlates with differences in disease prevalence among world populations. These findings inform genetic, biological, and epidemiological investigations of IgAN and permit cross-comparison with other complex traits that share genetic risk loci and geographic patterns with IgAN.
Conflict of interest statement
The authors have declared that no competing interests exist.
Figures
References
-
- Schena FP. A retrospective analysis of the natural history of primary IgA nephropathy worldwide. Am J Med. 1990;89:209–215. - PubMed
-
- Suzuki K, Honda K, Tanabe K, Toma H, Nihei H, et al. Incidence of latent mesangial IgA deposition in renal allograft donors in Japan. Kidney Int. 2003;63:2286–2294. - PubMed
-
- Julian BA, Quiggins PA, Thompson JS, Woodford SY, Gleason K, et al. Familial IgA nephropathy. Evidence of an inherited mechanism of disease. N Engl J Med. 1985;312:202–208. - PubMed
-
- O'Connell PJ, Ibels LS, Thomas MA, Harris M, Eckstein RP. Familial IgA nephropathy: a study of renal disease in an Australian aboriginal family. Aust N Z J Med. 1987;17:27–33. - PubMed
Publication types
MeSH terms
Substances
Grants and funding
LinkOut - more resources
Full Text Sources
Other Literature Sources
Research Materials
Miscellaneous
