. 2012;8(6):e1002781.
doi: 10.1371/journal.pgen.1002781. Epub 2012 Jun 21.

Base-pair resolution DNA methylation sequencing reveals profoundly divergent epigenetic landscapes in acute myeloid leukemia

Affiliations

Base-pair resolution DNA methylation sequencing reveals profoundly divergent epigenetic landscapes in acute myeloid leukemia

Altuna Akalin et al. PLoS Genet. 2012.

Abstract

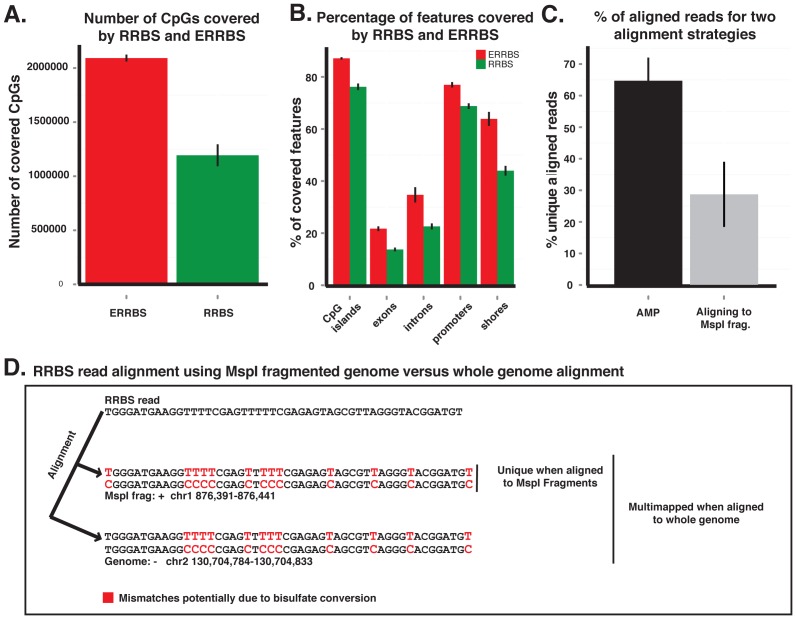
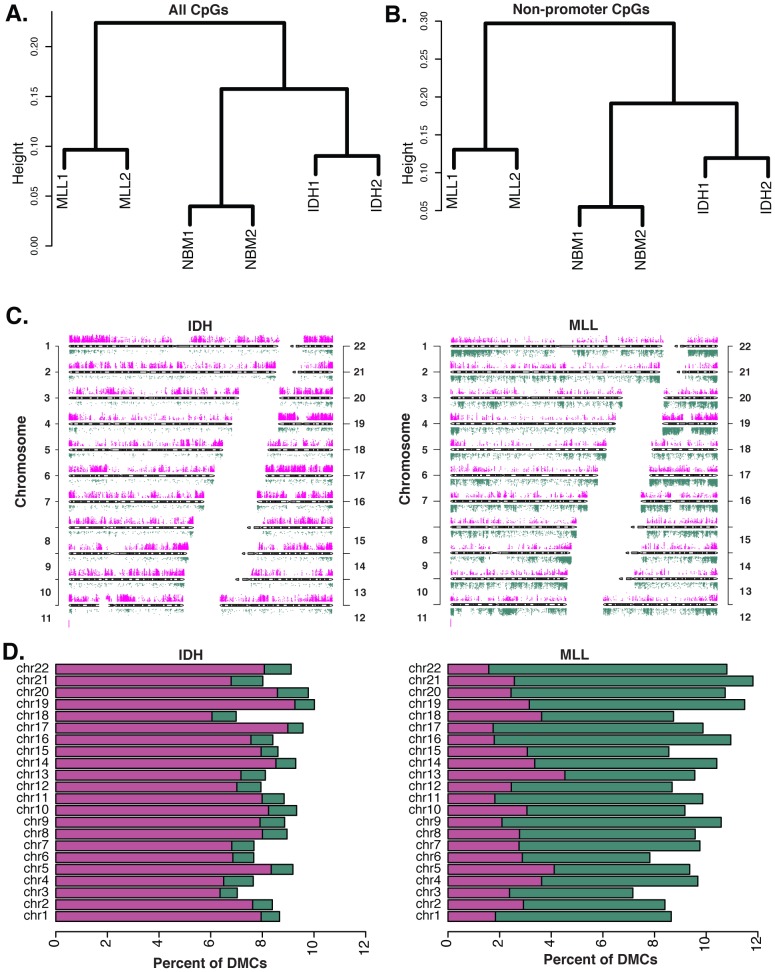
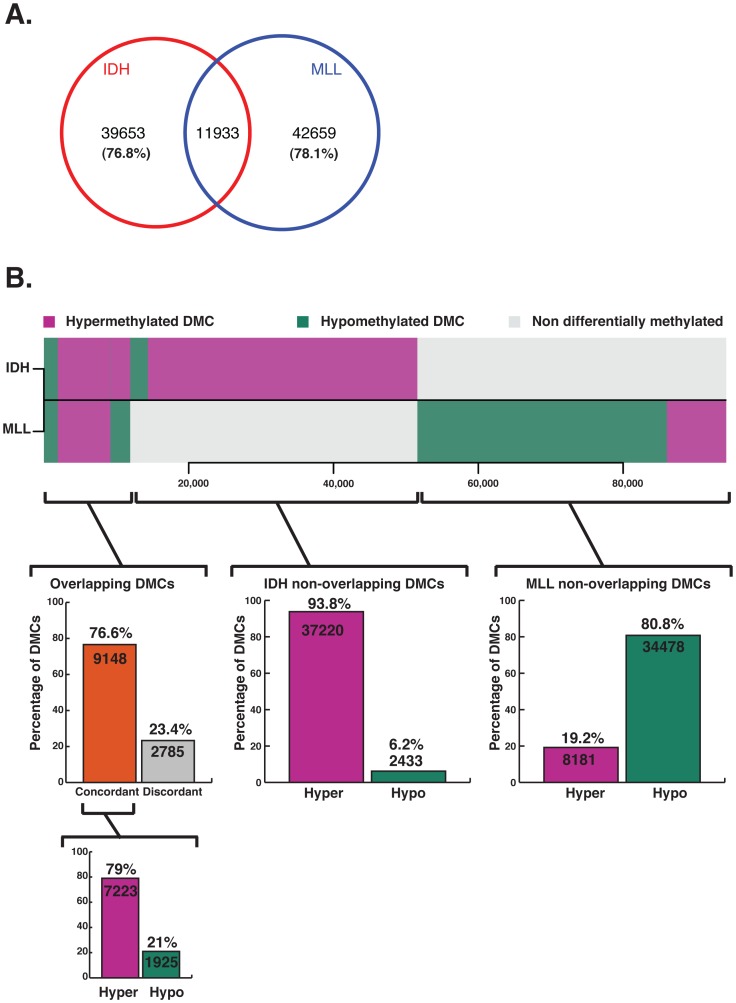
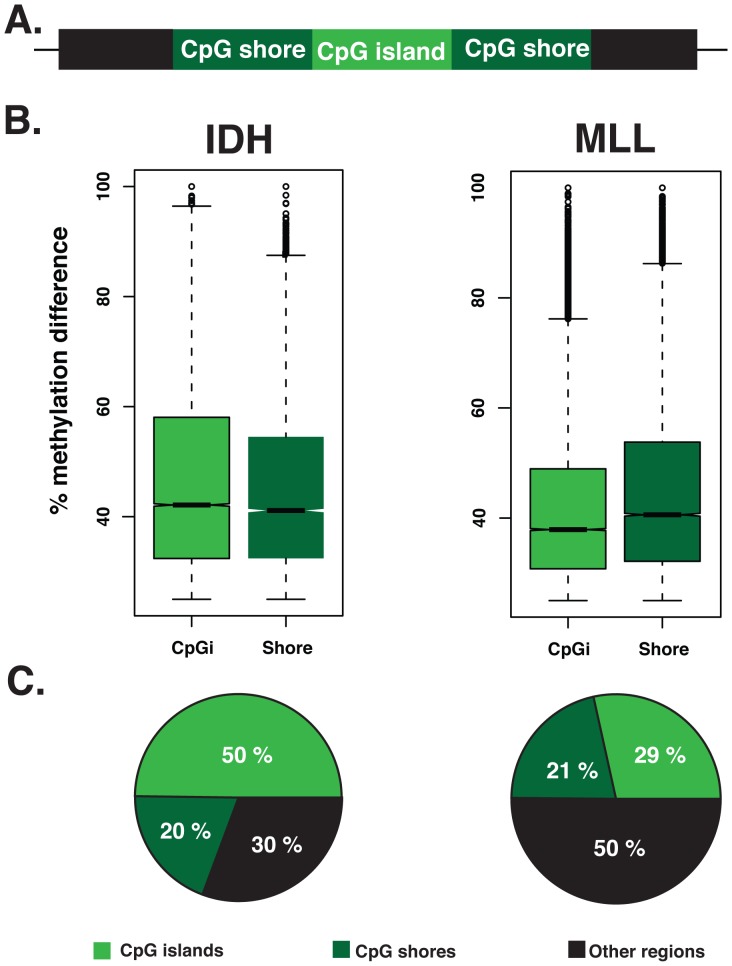
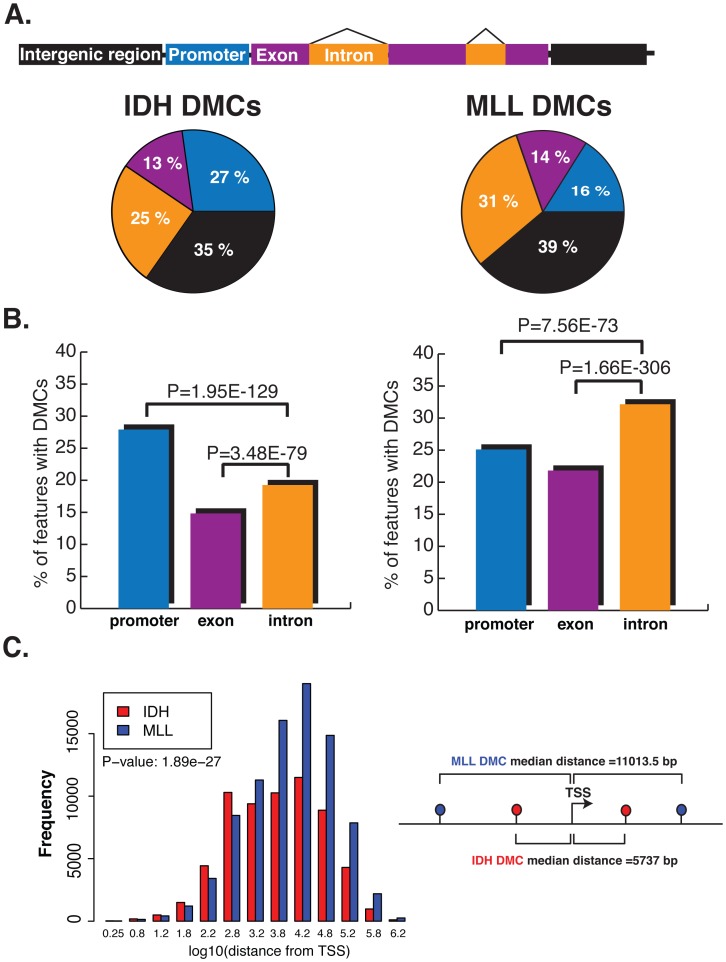
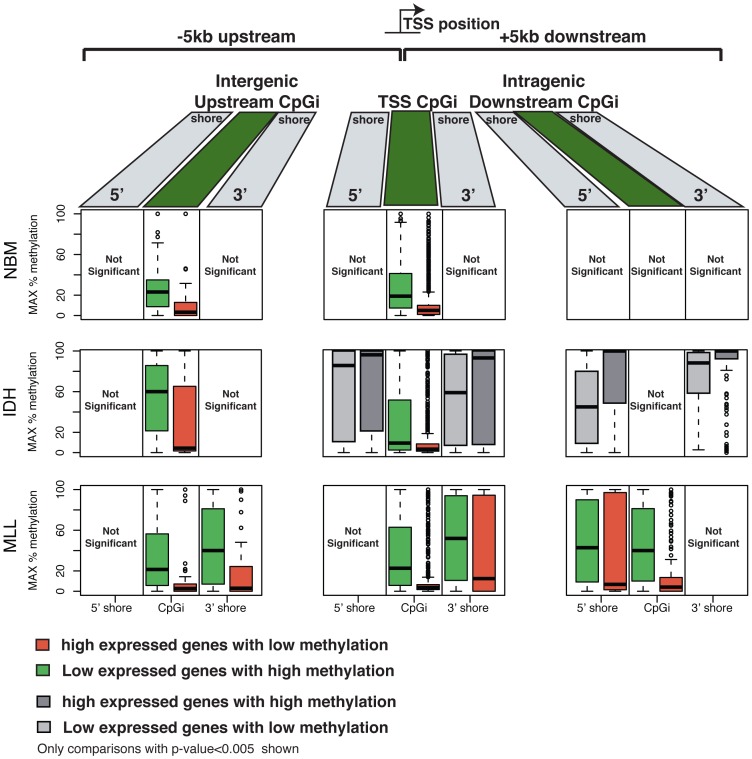
We have developed an enhanced form of reduced representation bisulfite sequencing with extended genomic coverage, which resulted in greater capture of DNA methylation information of regions lying outside of traditional CpG islands. Applying this method to primary human bone marrow specimens from patients with Acute Myelogeneous Leukemia (AML), we demonstrated that genetically distinct AML subtypes display diametrically opposed DNA methylation patterns. As compared to normal controls, we observed widespread hypermethylation in IDH mutant AMLs, preferentially targeting promoter regions and CpG islands neighboring the transcription start sites of genes. In contrast, AMLs harboring translocations affecting the MLL gene displayed extensive loss of methylation of an almost mutually exclusive set of CpGs, which instead affected introns and distal intergenic CpG islands and shores. When analyzed in conjunction with gene expression profiles, it became apparent that these specific patterns of DNA methylation result in differing roles in gene expression regulation. However, despite this subtype-specific DNA methylation patterning, a much smaller set of CpG sites are consistently affected in both AML subtypes. Most CpG sites in this common core of aberrantly methylated CpGs were hypermethylated in both AML subtypes. Therefore, aberrant DNA methylation patterns in AML do not occur in a stereotypical manner but rather are highly specific and associated with specific driving genetic lesions.


Conflict of interest statement

GPS, IK, LZ, and JB are currently or have until recently been employed by Illumina.

Figures

Figure 1
Figure 1. ERRBS improves genomic coverage and alignment accuracy.
(A) Average CpG number coverage for ERRBS (red) and RRBS (green) methods (n = 3, samples NBM_#2, AML and MLLr_#1). (B) Average percent coverage of different genomic regions by ERRBS (red) and RRBS (green) (n = 3, samples NBM_#2, AML and MLLr_#1) (C) Average percentage of uniquely aligned reads using a whole genome reference strategy (black) or an MspI in silico digested genome reference (gray) (n = 4, samples NBM_#2, AML_Rep#2, MLLr_#1 and MLLr_#2) (D) Example of a misalignment due to the use of a reduced representation bisulfite converted reference genome. The read aligns to a unique genomic location using the MspI alignment algorithm (forward strand, chr1: 876391–876441), however the same fragment does not align uniquely when using a whole genome alignment algorithm, rather it also aligns to the reverse strand of chr 2: 130,704,784–130,704,833.
Figure 2
Figure 2. Diametrically opposed DNA methylation patterns in MLLr and IDH-mut AMLs.
(A) Unsupervised analysis of DNA methylation by ERRBS using hierarchical clustering (distance = 1-Pearson correlation, Ward's agglomeration method) segregates the samples into their three biological groups using all CpGs. (B) This segregation is maintained when unsupervised analysis is performed on non-promoter CpGs. (C) Chromosome ideogram representing differential methylation in IDH-mut AMLs vs. NBM (left) and MLLr AMLs vs NBM (right). Only CpGs with q-value<0.01 and methylation difference of at least 25% are shown. Magenta points represent hypermethylation and green ones represent hypomethylation relative to NBM. (D) Stacking barplots showing percentage of hyper and hypomethylated DMCs out of all covered CpGs for each chromosome in IDH-mut AMLs (left) and MLLr AMLs (right). Green represents proportion of hypomethylated DMCs and magenta represents hypermethylated ones.
Figure 3
Figure 3. Aberrant methylation targets a minimally overlapping set of CpGs in IDH-mut and MLLr AMLs.
(A) Venn diagram representing differentially methylated CpGs identified for IDH-mut and MLLr AMLs from amongst the 574,178 CpGs adequately represented (>10× coverage) across all six samples. Most DMCs are unique to either AML subtype, with minimal amount of events occurring at common sites across IDH-mut and MLLr. (B) Horizontal barplot comparing the methylation status of CpG sites at DMCs in IDH-mut AML (top) and MLLr AML (bottom). Magenta depicts >25% hypermethylation relative to NBM, green represents >25% hypomethylation and gray represents no differential methylation. Most DMCs are non-overlapping between the two subtypes of AML and display opposite changes in methylation. However, amongst the smaller set of DMCs that do overlap between the two AML subtypes, the vast majority (76.6%) are concordantly changed, with a clear predominance for aberrrant hypermethylation of those sites (79%).
Figure 4
Figure 4. CpG islands and CpG shores show subtype-specific changes in the two types of AML.
(A) Schematic representation of a CpG island (light green), flanked upstream and downstream by 2 kb CpG shores (dark green) and the region that extends beyond CpG shores (black). (B) Boxplots illustrating the magnitude of the methylation difference relative to NBM at DMCs that are annotated to CpG islands and CpG shores in either IDH-mut (Left) or MLLr (right) AMLs. (C) Pie charts illustrating the relative proportion of DMCs annotated to CpG islands (light green), CpG shores (dark green) and regions beyond CpG shores (black) in IDH-mut (left) and MLLr (right) AMLs.
Figure 5
Figure 5. DMCs affect distinct genomic regions in IDH-mut and MLLr AMLs.
(A) Top: cartoon representation of the different genomic regions analyzed. Bottom: Pie charts illustrating the proportions of DMCs annotated to promoter regions (blue), exons (magenta), introns (orange) and intergenic regions (black) in IDH-mut (left) and MLLr (right) AMLs. (B) Barplots representing the percentage of promoters, introns and exons overlapping with a DMC in IDH-mut (left) and MLLr (right) AMLs. Significantly higher proportion of promoter regions were overlapping with a DMC in IDH-mut over introns and exons, while introns were the most frequently affected regions in MLLr AMLs. (C) Histogram representing the log10 distance of DMCs to the nearest Transcription Start Site (TSS) in IDH-mut (red) and MLLr (blue) AMLs.
Figure 6
Figure 6. DNA methylation and gene expression relationships display subtype-specific differences.
CpG islands and shores across the genome were categorized into those located upstream from a transcription start site (TSS), overlapping a TSS or located downstream from a TSS. Boxplots are plotted that illustrate the maximum DNA methylation levels at CpGs within these CpG islands and CpG shores for the top 15th percentile expressed genes (right) and the bottom 15th percentile expressed genes (left). Each row shows a representative sample for each type: Normal bone marrow (top); IDH-mut AML (middle) and MLLr AML (bottom). In all sample types CpG islands overlapping a TSS displayed lower methylation levels in highly expressed genes and higher methylation levels in genes that were expressed at low levels. In MLLr AMLs this relationship between expression and methylation levels further extended into CpG shores, and was also observed at CpG islands and shores upstream and downstream from the TSS. IDH-mut AMLs, and to a lesser degree NBM samples, displayed higher methylation levels at CpG shores of genes with high expression levels, while low methylation levels were observed at these shores for genes expressed at low levels.

References

    1. Dohner H, Estey EH, Amadori S, Appelbaum FR, Buchner T. Diagnosis and management of acute myeloid leukemia in adults: recommendations from an international expert panel, on behalf of the European LeukemiaNet. Blood. 2010;115:453–474. - PubMed
    1. Ayton PM, Cleary ML. Transformation of myeloid progenitors by MLL oncoproteins is dependent on Hoxa7 and Hoxa9. Genes & development. 2003;17:2298–2307. - PMC - PubMed
    1. Armstrong SA, Staunton JE, Silverman LB, Pieters R, den Boer ML. MLL translocations specify a distinct gene expression profile that distinguishes a unique leukemia. Nature Genetics. 2002;30:41–47. - PubMed
    1. Zeisig BB, Milne T, Garcia-Cuellar MP, Schreiner S, Martin ME. Hoxa9 and Meis1 are key targets for MLL-ENL-mediated cellular immortalization. Molecular and cellular biology. 2004;24:617–628. - PMC - PubMed
    1. Ward PS, Patel J, Wise DR, Abdel-Wahab O, Bennett BD. The common feature of leukemia-associated IDH1 and IDH2 mutations is a neomorphic enzyme activity converting alpha-ketoglutarate to 2-hydroxyglutarate. Cancer cell. 2010;17:225–234. - PMC - PubMed

Publication types

MeSH terms

Substances