. 2012;2(6):553-76.
doi: 10.7150/thno.4070. Epub 2012 Jun 4.

Protected Graft Copolymer (PGC) in Imaging and Therapy: A Platform for the Delivery of Covalently and Non-Covalently Bound Drugs

Affiliations

Protected Graft Copolymer (PGC) in Imaging and Therapy: A Platform for the Delivery of Covalently and Non-Covalently Bound Drugs

Alexei A Bogdanov Jr et al. Theranostics. 2012.

Abstract

Initially developed in 1992 as an MR imaging agent, the family of protected graft copolymers (PGC) is based on a conjugate of polylysine backbone to which methoxypoly(ethylene glycol) (MPEG) chains are covalently linked in a random fasion via N-ε-amino groups. While PGC is relatively simple in terms of its chemcial composition and structure, it has proved to be a versatile platform for in vivo drug delivery. The advantages of poly amino acid backbone grafting include multiple available linking sites for drug and adaptor molecules. The grafting of PEG chains to PGC does not compromise biodegradability and does not result in measurable toxicity or immunogenicity. In fact, the biocompatablility of PGC has resulted in its being one of the few 100% synthetic non-proteinaceous macromolecules that has suceeded in passing the initial safety phase of clinical trials. PGC is capable of long circulation times after injection into the blood stream and as such found use early on as a carrier system for delivery of paramagnetic imaging compounds for angiography. Other PGC types were later developed for use in nuclear medicine and optical imaging applications in vivo. Recent developments in PGC-based drug carrier formulations include the use of zinc as a bridge between the PGC carrier and zinc-binding proteins and re-engineering of the PGC carrier as a covalent amphiphile that is capabe of binding to hydrophobic residues of small proteins and peptides. At present, PGC-based formulations have been developed and tested in various disease models for: 1) MR imaging local blood circulation in stroke, cancer and diabetes; 2) MR and nuclear imaging of blood volume and vascular permeability in inflammation; 3) optical imaging of proteolytic activity in cancer and inflammation; 4) delivery of platinum(II) compounds for treating cancer; 5) delivery of small proteins and peptides for treating diabetes, obesity and myocardial infarction. This review summarizes the experience accumulated by various research groups that chose to use PGC as a drug delivery platform.

Keywords: chelate; contrast agent; gadolinium.; gaft-copolymer; paramagnetic; poly(ethylene glycol).


Conflict of interest statement

Competing Interests: The authors have declared that no competing interest exists.

Figures

Figure 1
Figure 1
PGC synthesis. Synthesis of a graft copolymer of polylysine and methoxypolyethylene glycol succinate (MPEG)S with subsequent modification of free amino groups with diagnostic labels or adaptor molecules for loading of therapeutics (R). The synthesis consits of a synthesis of MPEG sulfosuccinimide ester in the presence of water-soluble carbodiimide, acylation of 20-30% of total available amin groups of poly-lysine followed by the acylation of amino groups with an activated analog of R (R-x), usually N-hydroxysuccinimide ester.
Figure 2
Figure 2
Protective elements in PGC and low immunogenicity. A - an approximate 3D-model of a PGC fragment showing the major elements of the graft copolymer structure (courtesy of Terence O'Loughlin, M.D., MGH-CMIR); B - the comparison of immune response to DTPAGd conjugated either to a protein (BSA-DTPAGd, open symbols) or to PGC (closed symbols) as determined by ELISA of blood plasma (in mice, n=3) using ovalbumin conjugated to DTPAGd for detecting the formation of antibodies. The numbers in parenthesis indicate the time interval before Gd injection and ELISA test. Adapted from .
Figure 3
Figure 3
Resistance to transchelation, degradation in blood, and biodistribution in vivo. A- size exclusion HPLC profiles (scintillation radioactivity detector) of 111In-labeled, Gd-saturated sample of PGC-DTPA incubated in saline or PBS/2 mg/ml apo-transferrin for 48 h; B- size exclusion HPLC of 111In-labeled, Gd-saturated sample of PGC-DTPA incubated in PBS or whole blood for 48 h. The arrow shows the shift of the peak migration and the formation of a shoulder indicating biodegradation. C - residual blood-corrected biodistribution of PGC-DTPA (111In-labeled, Gd-saturated) in R3230 AC implanted Fisher rats (n=4 for each time point). Adapted from .
Figure 4
Figure 4
Imaging of vascular supply using PGC-DTPAGd. A- maximum intensity pixel (MIP) projection image of blood circulation in a mouse obtained using gradient-echo pulse sequence (1.5T, GRASS, TR/TE 60/8, FA 60, 2NEX, 8 cm field of view) after injecting PGC-DTPAGd at 25 µmol Gd/kg; B- a MIP image showing circulation in the head of a rat (imaging parameters similar to that of A); C - an improvement in imaging detail of rat cerebral circulation at 9.4T results from increased dose of PGC-DTPAGd (150 µmol Gd/kg) due to the lower molar relaxivity of Gd3+ at high magnetic fields. Adapted from , .
Figure 5
Figure 5
PGC as a blood pool imaging agent. A- a fusion SPECT/CT image of a rat 30 min after the injection of 99mTc-labeled PGC (2 mg PGC-DTPA/kg, 1 mCi 99mTc/rat). The image was obtained using NanoSPECT/CT (Bioscan Inc.); B- an image obtained in a healthy volunteer during Phase I clinical trials. Serial anterior whole-body images are shown taken immediately (30 min) and 2 h after the injection of 25 µg PGC-[99mTc]DTPA/kg (total dose - 20 mCi 99mTc). Note the distribution in the blood pool and low uptake in the lung, spleen and liver. Adapted from .
Figure 6
Figure 6
MR imaging of tumor neovascularity and interstitial leakage in a rat model of adenocarcinoma. A-C- a MIP projection (A) and two non-consecutive MR imaging slices obtained 30 min after I.V injection of PGC-DTPA(Gd) in rats with R3230 adenocarcinoma. D-F - MR images obtained in the same animal 48 h after the injection of PGC-DTPAGd. Note accumulation in the tumor at 48 h (the location of the tumor is shown by arrowheads). For MR imaging conditions see Figure 4A, legend. Adapted from .
Figure 7
Figure 7
PGC-DTPAGd in imaging of anti-angiogenesis. A,B- histology of MV522 tumors prior to (A) and after treating animals with VEGFR2 tyrosine kinase inhibitor (TKI). Anti-CD31 staining (blue) reflects changes in vascular diameter and density. C - The dependence of absolute tissue blood volume fraction (Vb), measured after the injection of 50 µmol Gd/kg of PGC-DTPAGd from flip angle of MR SPGR pulse sequence that reflects changes of Vb due to TKI treatment. The slopes reflect changes in water exchange rates across the blood vessel wall. Adapted from .
Figure 8
Figure 8
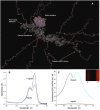
PGC-based protease-sensing optical imaging probe. A - a computer-generated model (Molecular operating environment, MOE) of a Cy5.5 cynaine dye-conjugated PGC showing 12 MPEG protective chains linked to a PL backbone (degree of polymerization - n=50) with the rest of N-ε-amino groups modified by cyanine dye. A molecule of trypsin (a model serine protease, m.w. 22 kD) is shown for comparison. The modeling was performed assuming a tetramolecular water hydration layer which is not shown (Laboratory of Molecular Imaging Probes, University of Massachusetts Medical School); B - change of Cy5.5 absorbance spectra before and after the trypsinolysis of N-ε-cyanine modified PGC; C - the increase of Cy5.5 fluorescence excitation and emission values after treating PGC-Cy5.5 with trypsin which translates into an increase of fluorescence intensity detectable with imaging after the trypsinolysis (inset, , -T - in the absence and +T in the presence of trypsin). Adapted from .
Figure 9
Figure 9
Imaging of PGC-Cy5.5 breakedown in mammary adenocarcinoma tumors. A- the immunoblot demonstrating a higher level of cathepsin B expression in DU4475 than in BT20 tumors, with the band integration profiles shown below the image of a blot. Reproduced with a permission from ; B - ex vivo planar imaging of Cy5.5 fluorescence in adenocarcinoma samples and the corresponding in vivo image of orthotopic tumors implanted in the same animal bilaterally (shown by yellow arrowheads). The animals were injected with 2 nmol of Cy5.5 conjugated to PGC 24 h prior to optical imaging.
Figure 10
Figure 10
Targeted antibody and non-targeted PGC accumulation in the same LX-1 non-small cell lung carcinoma model. A - a time course of 111In-labeled monoclonal internalizing antibody BR96 and PGC uptake in LX-1 cells; B - biodistribution of 111In-PGC (blue bars) and 111In-BR96 (grey bars) in LX-1 xenografts after intravenous injection in LX-1 bearing mice at 24h (n=4 animals/time point). Adapted from .
Figure 11
Figure 11
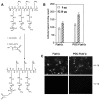
Human endothelial cell activation-dependent uptake of anti-E-selectin conjugated PGC. A - synthesis of anti-E selectin targeted PGC using SATA-modified F(ab')2 antibody fragment conjugated to heterobifunctional PEG-linkers carrying vinyl sulfone groups; B - comparative uptake of non-conjugated F(ab')2 antibody fragments and PGC- F(ab')2 conjugate; C - fluorescence microscopy of IL-1β activated and non-activated cells demonstrating the uptake of both Cy5.5-labeled antibody fragment and PGC- F(ab')2 in LX-1 cells. Adapted from .
Figure 12
Figure 12
HC-PGC as a drug carrier. A- a computer generated model of HC-PGC fragment with MPEG protective chains (shown space filled) and hydrophobic elements represented by fatty acid residues; B - a computer simulated representation of a leptin molecule binding to the hydrophobic “core”. Interacting surfaces are shown in green and grey for leptin and HC-PGC, respectively. The modeling is performed in MOE (Laboratory of Molecular Imaging Probes, Univesity of Massachusetts Medical School).
Figure 13
Figure 13
Polypeptide binding to HC-PGC and the release of HC-PGC bound cargo after the I.V. administration. A - The binding of atrial natriuretic peptide (ANP) and leptin to HC-PGC. The affinity to HC-PGC correlates with GRAVY index (hydropathicity, leptin>ANP) and the capacity of HC-PGC carrier inversely correlates with peptide mass (ANP<leptin). B - reversible association of ANP with HC-PGC enables sustained release after intravenous administration in mice (2µg peptide/animal, n=4, group) with a resultant strong increase of AUC compared to native ANP (Data provided by Pharmain Corp. Seattle WA).

References

    1. Toncheva V, Wolfert MA, Dash PR, Oupicky D, Ulbrich K, Seymour LW. et al. Novel vectors for gene delivery formed by self-assembly of DNA with poly(L-lysine) grafted with hydrophilic polymers. Biochim Biophys Acta. 1998;1380:354–68. - PubMed
    1. Choi YH, Liu F, Kim JS, Choi YK, Park JS, Kim SW. Polyethylene glycol-grafted poly-L-lysine as polymeric gene carrier. J Control Release. 1998;54:39–48. - PubMed
    1. Bogdanov A, Kayne L, Weissleder R. Graft copolymers as carriers for systemic delivery of expression vectors. In: Controlled Release Society I, editor. The 25th Int. Symp. Controlled Rel. Bioact. Mater. Las Vegas, NV: Controlled Release Society, Inc; 1998. pp. 91–2.
    1. Read ML, Dash PR, Clark A, Howard KA, Oupicky D, Toncheva V. et al. Physicochemical and biological characterisation of an antisense oligonucleotide targeted against the bcl-2 mRNA complexed with cationic-hydrophilic copolymers. Eur J Pharm Sci. 2000;10:169–77. - PubMed
    1. Choi YR, Chae SY, Ahn CH, Lee M, Oh S, Byun Y. et al. Development of polymeric gene delivery carriers: PEGylated copolymers of L-lysine and L-phenylalanine. J Drug Target. 2007;15:391–8. - PubMed