

A computational study on altered theta-gamma coupling during learning and phase coding
- PMID: 22737207
- PMCID: PMC3380897
- DOI: 10.1371/journal.pone.0036472
A computational study on altered theta-gamma coupling during learning and phase coding
Abstract
There is considerable interest in the role of coupling between theta and gamma oscillations in the brain in the context of learning and memory. Here we have used a neural network model which is capable of producing coupling of theta phase to gamma amplitude firstly to explore its ability to reproduce reported learning changes and secondly to memory-span and phase coding effects. The spiking neural network incorporates two kinetically different GABA(A) receptor-mediated currents to generate both theta and gamma rhythms and we have found that by selective alteration of both NMDA receptors and GABA(A,slow) receptors it can reproduce learning-related changes in the strength of coupling between theta and gamma either with or without coincident changes in theta amplitude. When the model was used to explore the relationship between theta and gamma oscillations, working memory capacity and phase coding it showed that the potential storage capacity of short term memories, in terms of nested gamma-subcycles, coincides with the maximal theta power. Increasing theta power is also related to the precision of theta phase which functions as a potential timing clock for neuronal firing in the cortex or hippocampus.
Conflict of interest statement
Figures
 and
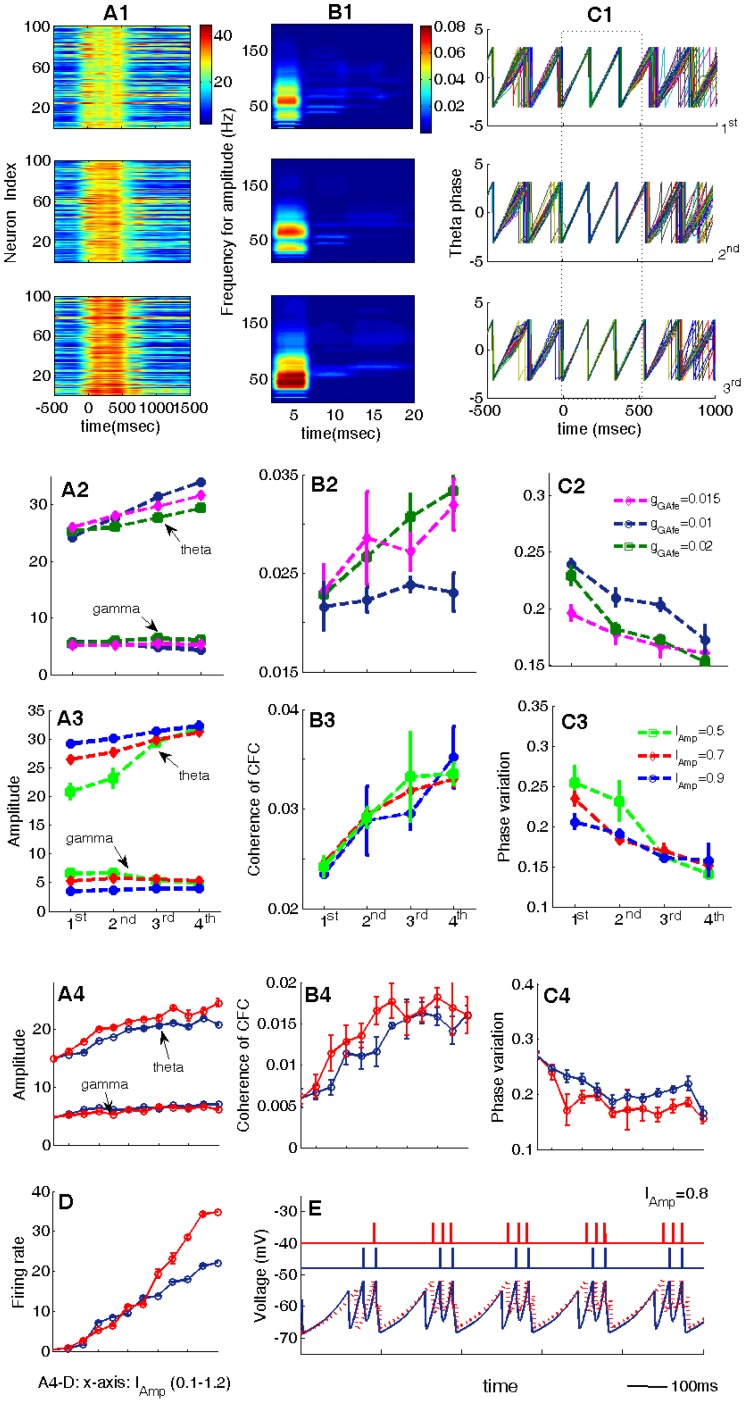
and  on the theta and gamma amplitudes, the coherence of cross-frequency coupling, the tightness of theta phase.
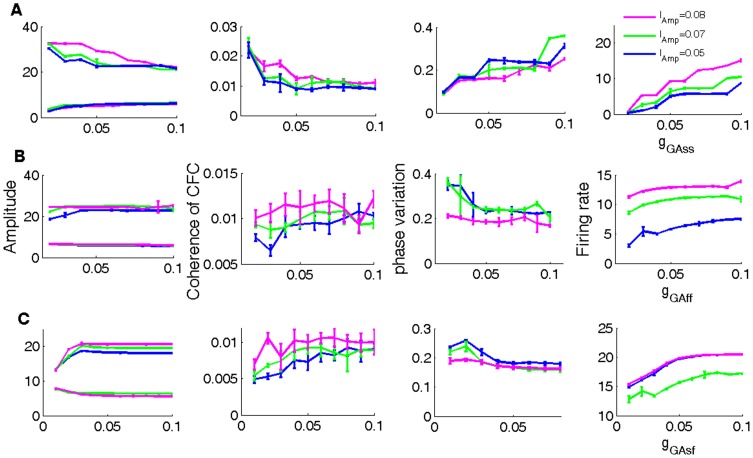
 and
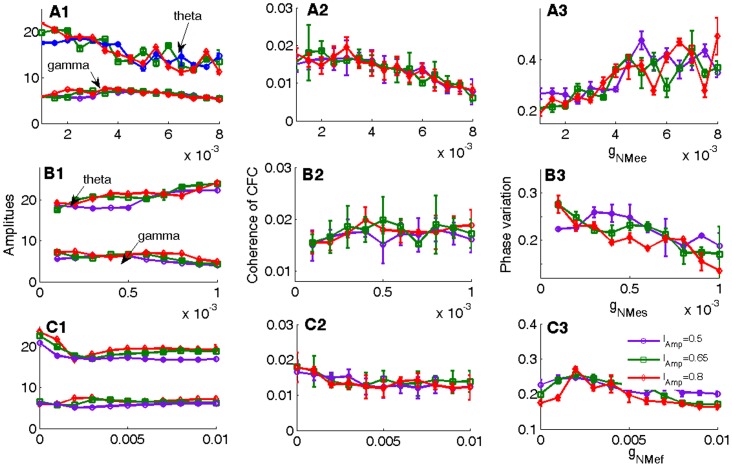
and  are depicted, respectively. (A) shows the effect of increasing
  , (B) shows the effect of increasing
  , (C) shows the effect of increasing
  .
.
 ,
,  and the GABAA,slow mediated conductance
  as: 0.0001, 0.001, 0.05 (1st), 0.00025, 0.0025,0.06 (2nd), 0.00035 and 0.004, 0.07 (3rd), 0.00045, 0.005, 0.08(4th). The values of
  and
and  in the three panels in A1–C1 are corresponding to the three marked points (1st, 2nd and 3rd) in A2–C3. The values of other parameters are stated in Table 1. (A4–C4) Variations of theta and gamma amplitudes, the coherence of cross-frequency coupling and the phase variation with the increase of
  . (D) The firing rates of a downstream neuron vs.
 . (E) Comparison of the membrane potentials of single EX neurons before and after learning. In (C) the blue curve where
  represents before learning, while the red one where
  represents after learning.
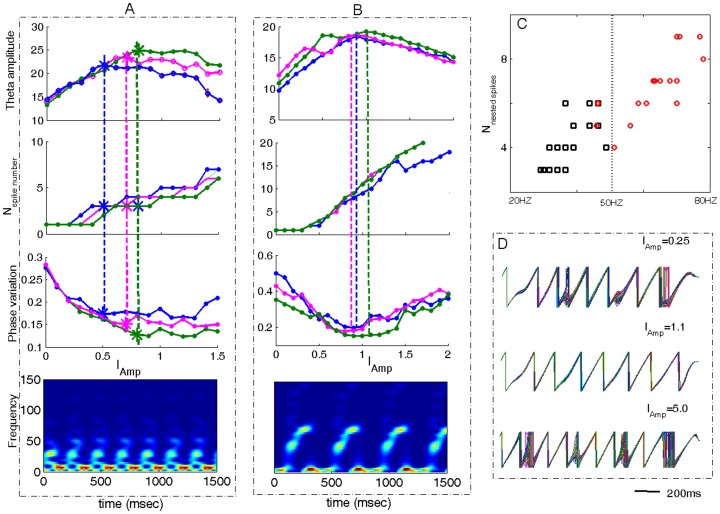
 , the corresponding number of nested spikes per theta cycle vs.
 , theta phase variation vs.
  , and the time-frequency spectra at
  of one curve. In (A),
  the three curves correspond to
  . In (B),
  , the three curves correspond to
  . (C) The number of nested spikes per theta cycle calculated at
  vs. the frequency of the corresponding maximal gamma power. The marked points are obtained from different curves of theta amplitude vs.
  . One can see that for low gamma power (20–50 Hz), around 5±2 spikes could be nested in each theta cycle, while for high gamma power (>50 Hz), around 7±2 spikes could be nested. (D) Theta phases of the EX cells for different stimulus strength. It was shown that for too weak and too strong stimulus, the theta phases of neurons are less synchronized than that of the intermediate stimulus strength.
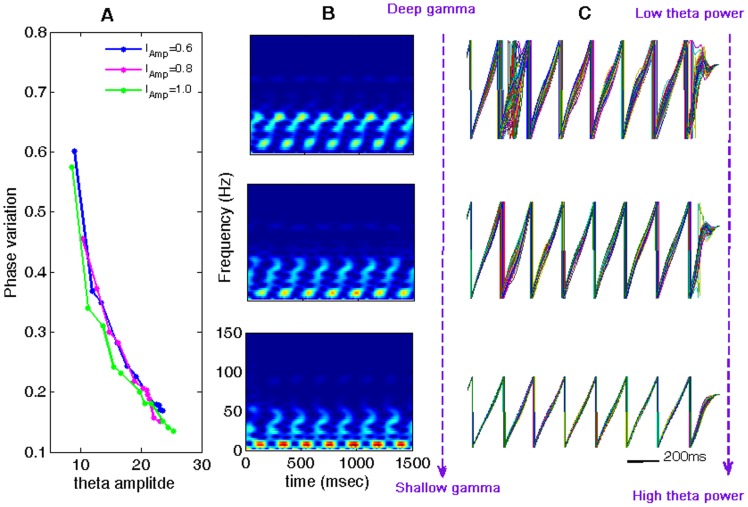
 . (B) and (C). From the upper panel to the bottom panel are corresponding to three points chosen for low, intermediate and high theta powers in (A) for
  . It was shown in that with the increase of theta amplitude, gamma oscillation becomes more and more shallowly nested in the theta rhythm, and meanwhile, the theta-band phases among EX neurons become more and more concentrated.
References
-
- Buzsaki G. Theta oscillations in the hippocampus. Neuron. 2002;33:325–340. - PubMed
-
- Buzsaki G. Rhythms of the Brain: Oxford University Press. 2006.
-
- Brankack J, Stewart M, Fox SE. Current source density analysis of the hippocampal theta rhythm: associated sustained potentials and candidate synaptic generators. Brain Res. 1993;615:310–327. - PubMed
Publication types
MeSH terms
Substances
LinkOut - more resources
Full Text Sources
