. 2012;7(6):e39543.
doi: 10.1371/journal.pone.0039543. Epub 2012 Jun 21.

Endothelial cells obtained from patients affected by chronic venous disease exhibit a pro-inflammatory phenotype

Affiliations

Endothelial cells obtained from patients affected by chronic venous disease exhibit a pro-inflammatory phenotype

Veronica Tisato et al. PLoS One. 2012.

Abstract

Background: The inflammatory properties of vein endothelium in relation to chronic venous disease (CVD) have been poorly investigated. Therefore, new insights on the characteristics of large vein endothelium would increase our knowledge of large vessel physiopathology.

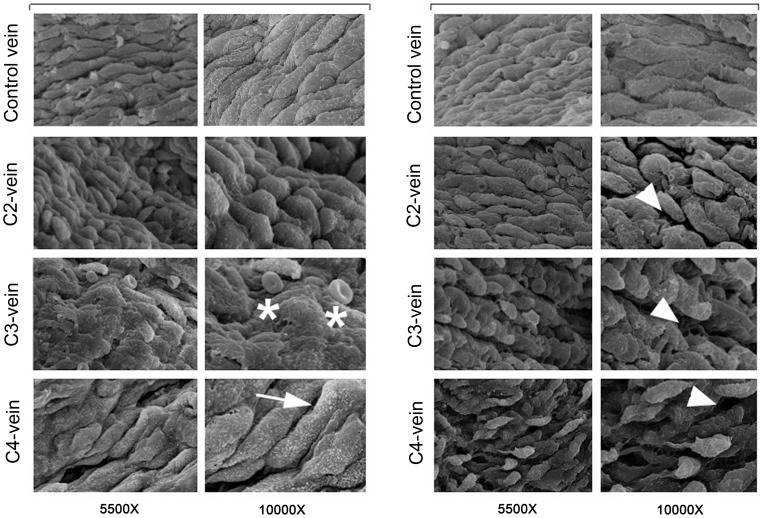
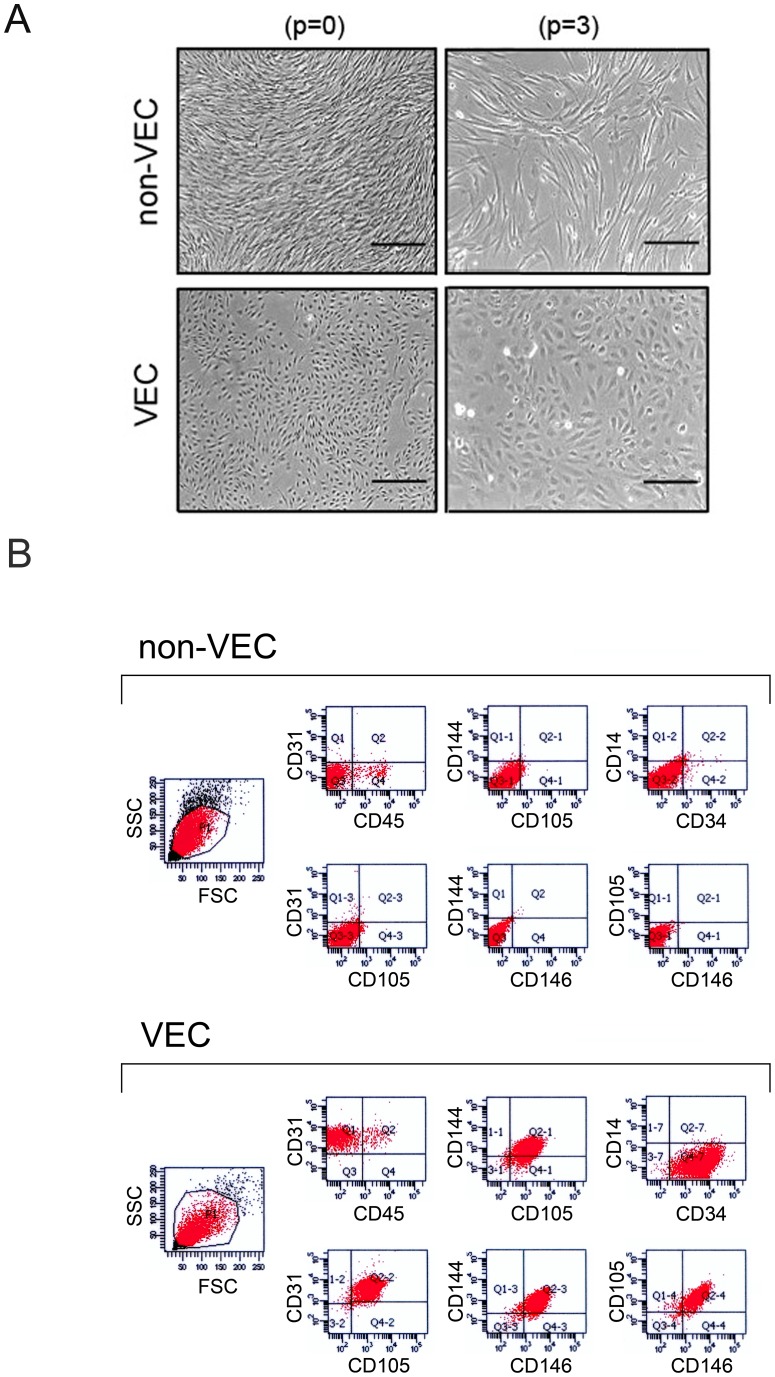
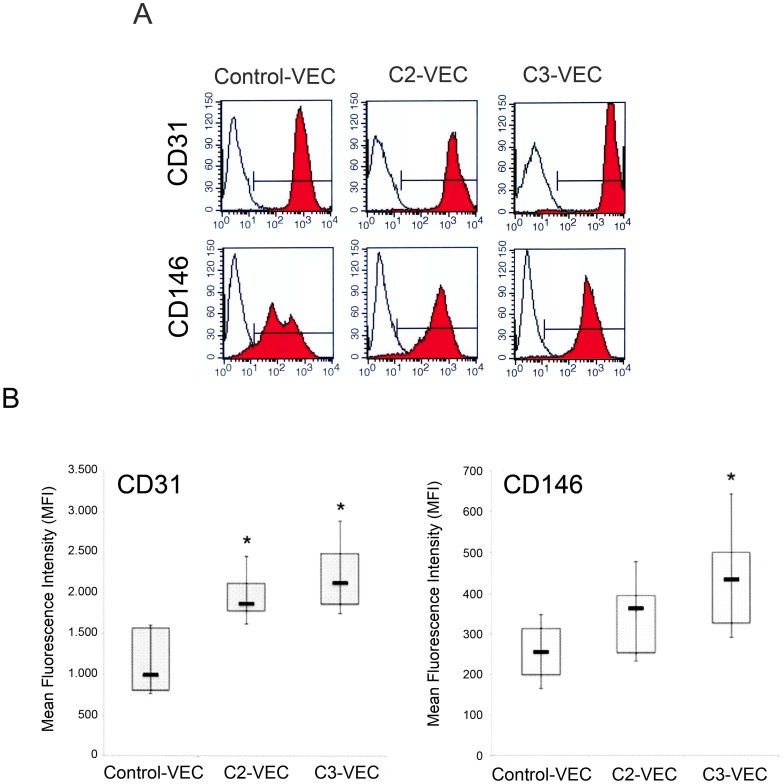
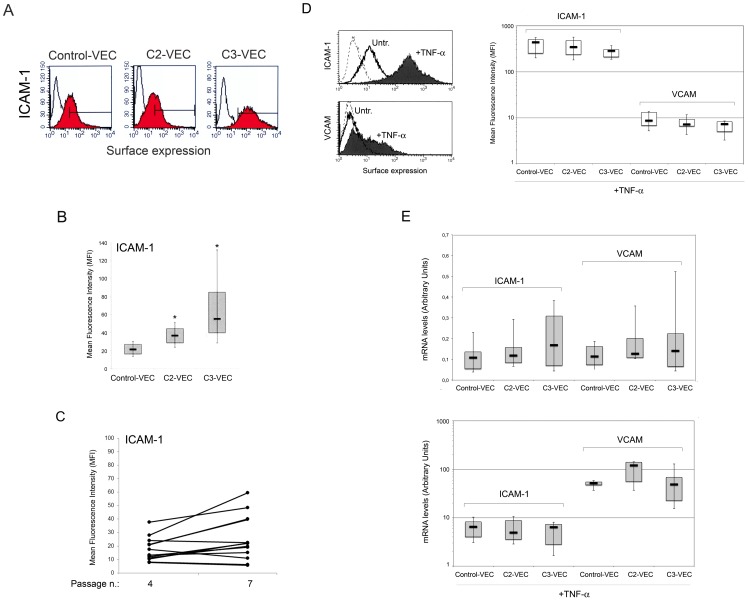
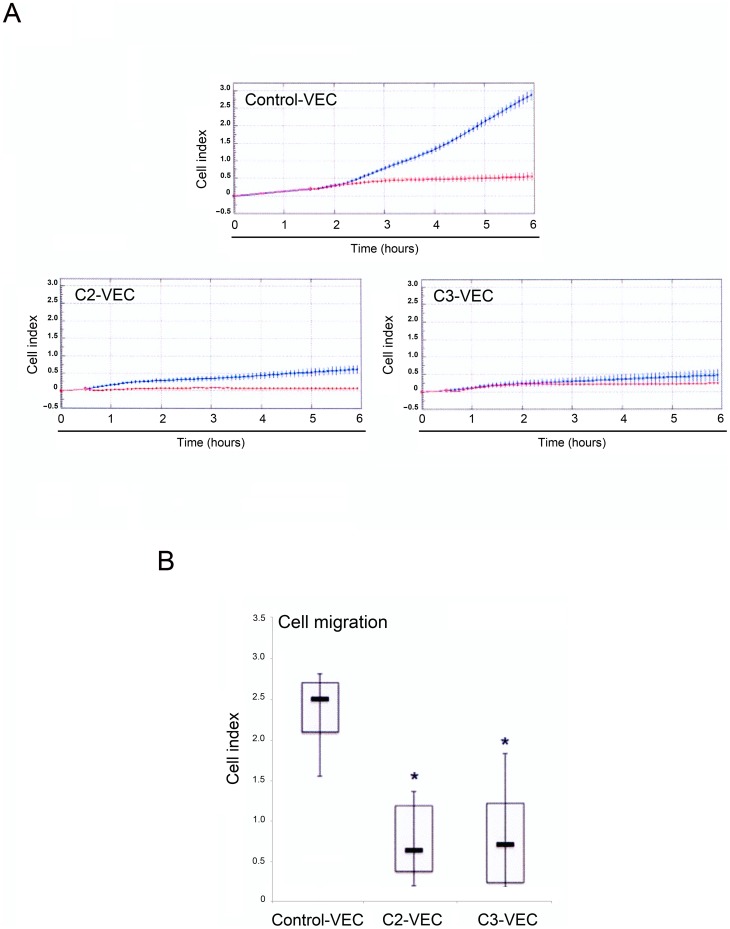
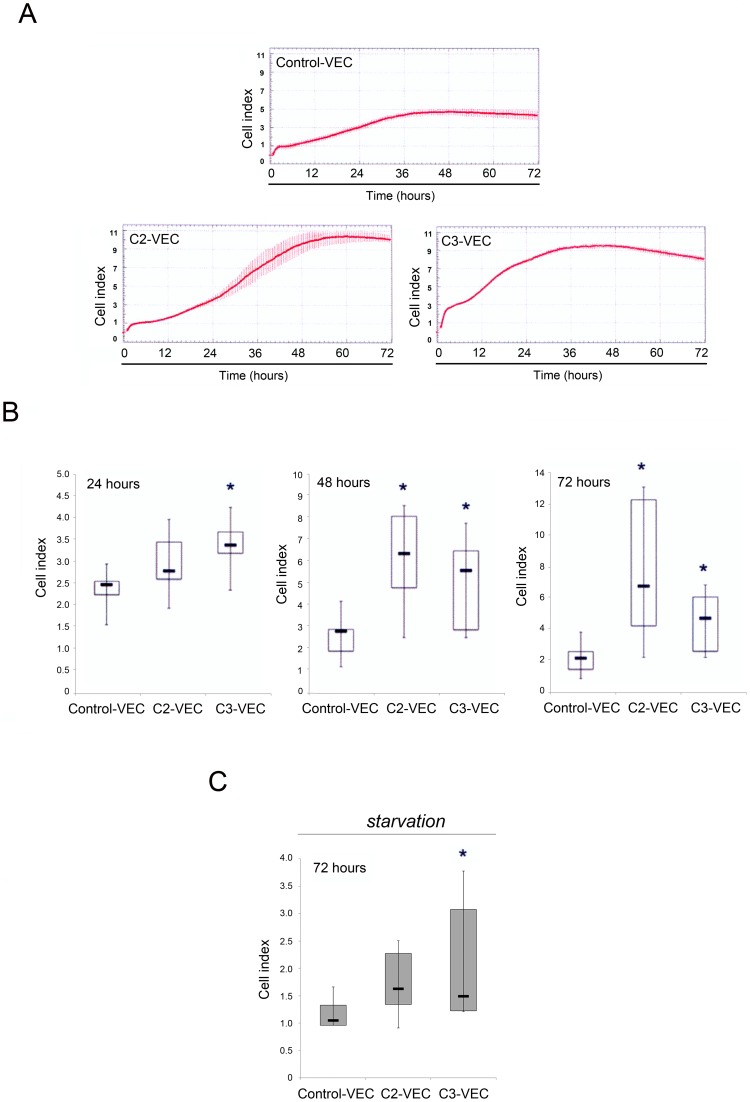
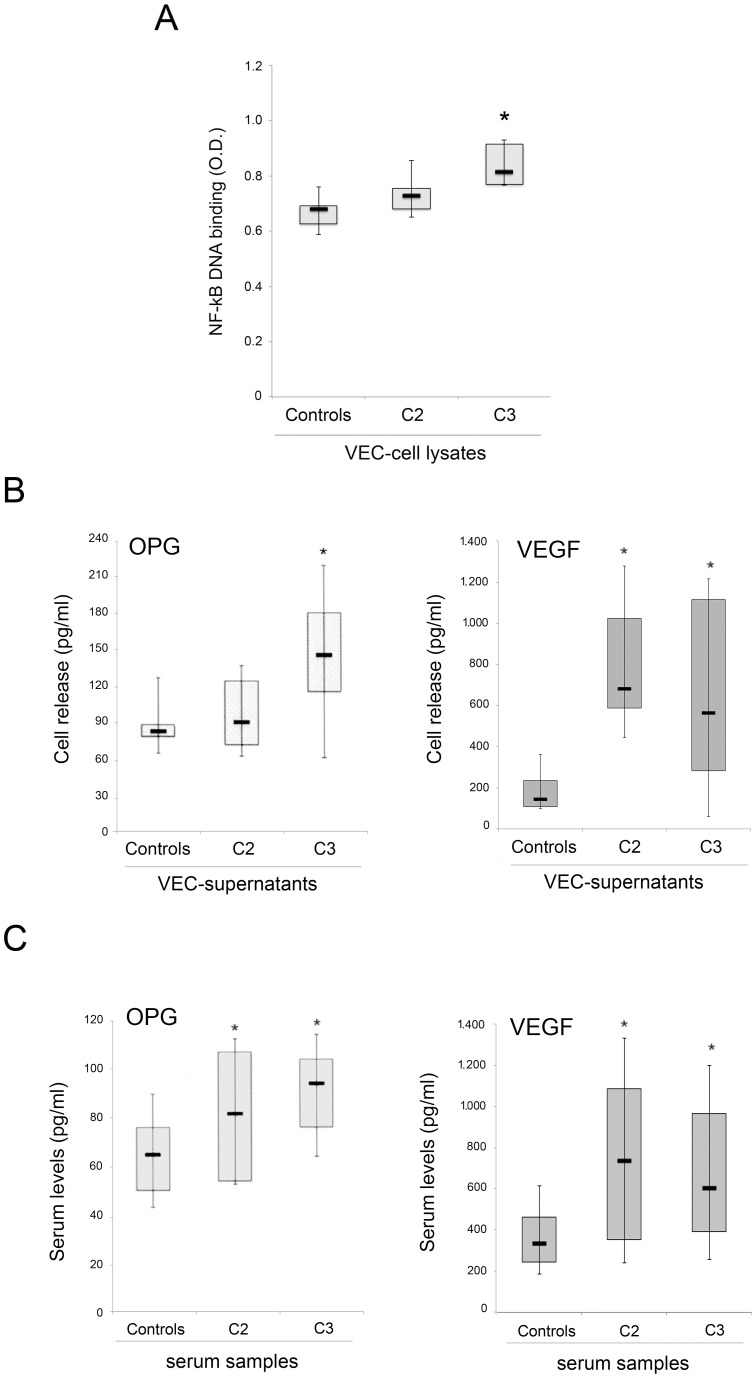
Methodology/principal findings: Surgical specimens of veins were obtained from the tertiary venous network (R3) and/or saphenous vein (SF) of patients affected by CVD and from control individuals. Highly purified venous endothelial cell (VEC) cultures obtained from CVD patients were characterized for morphological, phenotypic and functional properties compared to control VEC. An increase of CD31/PECAM-1, CD146 and ICAM-1 surface levels was documented at flow cytometry in pathological VEC with respect to normal controls. Of note, the strongest expression of these pro-inflammatory markers was observed in VEC obtained from patients with more advanced disease. Similarly, spontaneous cell proliferation and resistance to starvation was higher in pathological than in normal VEC, while the migratory response of VEC showed an opposite trend, being significantly lower in VEC obtained from pathological specimens. In addition, in keeping with a higher baseline transcriptional activity of NF-kB, the release of the pro-inflammatory cytokines osteoprotegerin (OPG) and vascular endothelial growth factor (VEGF) was higher in pathological VEC cultures with respect to control VEC. Interestingly, there was a systemic correlation to these in vitro data, as demonstrated by higher serum OPG and VEGF levels in CVD patients with respect to normal healthy controls.

Conclusion/significance: Taken together, these data indicate that large vein endothelial cells obtained from CVD patients exhibit a pro-inflammatory phenotype, which might significantly contribute to systemic inflammation in CVD patients.


Conflict of interest statement

Competing Interests: The authors have declared that no competing interests exist.

Figures

Figure 1
Figure 1. In situ morphological characterization of large vein endothelium.
Morphological investigation of endothelium obtained from control and CVD (from C2 to C4 stages) veins was performed by SEM. A representative panel composed of images from 2 control specimens and 6 pathological veins (2 for each CEAP stage) is shown. In C2-, C3- and C4-veins, luminal pathological vessel surfaces were covered by endothelial cells characterized by an irregular orientation and several morphological abnormalities, such as: discontinuous surface of the endothelium (arrowheads), which increases with the severity of the disease, presence of plaques covering the endothelial surface (asterisks) and/or presence of numerous microvilli (arrow). Red cells adhering to endothelium were frequently observed (left C3 images).
Figure 2
Figure 2. Isolation and phenotypic characterization of large vein endothelial cells.
Cells isolated from surgical specimens were characterized in-vitro by morphological assessment (A) and multiparametric flow cytometry analysis (B). In A, cell morphology was examined by using phase-contrast microscopy. VEC cultures were characterized by regular polygonal shape and dimensions and uniform monolayer. On the other hand, non-VEC cultures appeared with a fibroblast-like morphology characterized by elongated shapes and growing in an uneven manner. Representative images of VEC and non-VEC cultures, at two different in vitro passages (p = 0 and p = 3), are shown. Left panels: 10X, original magnification; right panels: 20X original magnifications. In B, multiparametric flow cytometry analyses were performed with a specific panel of endothelial cells defining antibodies. VEC were defined as CD146+/CD144+/CD31+/CD105+/CD34+/CD45/CD14 while non-VEC displayed a more variable and random pattern of antigens expression. Two representative multiparametric flow cytometry analysis panels of a non-VEC and pure VEC cultures are shown as two-colors dot plots.
Figure 3
Figure 3. Differential phenotype between control and pathological VEC.
Surface expression of CD31 and CD146 was evaluated by flow cytometry in either pathological and control-VEC. In A, colored histograms represent cells stained with monoclonal antibodies specific for the indicated antigens and white histograms represent background fluorescence obtained by staining the same cells with isotype-matched control antibodies. Representative panels for control, C2- and C3-VEC are shown. In B, the expression levels of the indicated antigens were determined for all VEC samples (8 C2-VEC, 13 C3-VEC and 5 control-VEC) by flow cytometry analysis and expressed as mean fluorescence intensity (MFI). Horizontal bars are median, upper and lower edges of box are 75th and 25th percentiles, lines extending from box are 10th and 90th percentiles. *P<0.05 compared to control VEC.
Figure 4
Figure 4. Analysis of ICAM-1 and VCAM expression in control and pathological VEC.
In A–C, surface expression of ICAM-1 antigen was evaluated by flow cytometry in either pathological and control-VEC. In A, colored histograms represent cells stained with monoclonal antibodies specific for the indicated antigens and white histograms represent background fluorescence obtained by staining the same cells with isotype-matched control antibodies. A representative panel for control-, C2- and C3-VEC is shown. In B, the expression levels of ICAM-1 were determined for all VEC samples (8 C2-VEC, 13 C3-VEC and 5 control VEC) by flow cytometry analysis and expressed as mean fluorescence intensity (MFI). *P<0.05 compared to control VEC. In C, comparative analysis of ICAM-1 surface expression, reported as MFI, at different VEC passages. In D–E, pathological and control-VEC cultures were exposed to TNF-α for 18 hours before ICAM-1 and VCAM surface expression analysis by flow cytometry (D), and mRNA levels analysis by quantitative RT-PCR (E). In D, two representative panels are shown: dotted histograms represent background fluorescence obtained by staining the same cells with isotype-matched control antibodies. The expression levels of ICAM-1 and VCAM, determined for all VEC samples by flow cytometry analysis upon TNF-α stimulation, are expressed as mean fluorescence intensity (MFI). In E, mRNA expression levels of ICAM-1 and VCAM were determined both in unstimulated and TNF-α-stimulated VEC cultures. Results from amplifications, done in duplicate, are expressed as arbitrary units, after normalization for the housekeeping gene. Horizontal bars are median, upper and lower edges of box are 75th and 25th percentiles, lines extending from box are 10th and 90th percentiles.
Figure 5
Figure 5. Differential migration kinetics between control and pathological VEC.
Control and pathological VEC cells were seeded at 2.5x10⁴ cells in fibronectin-coated 16 wells CIM-plates, and migration kinetics were analyzed in the absence or presence of 10% FBS in the bottom chamber and recorded by the xCELLigence real time cell analyzer. Cell migration was evaluated for all VEC cultures by using the recording changes in impedance and was expressed as cell index (CI). In A, representative panels of control-VEC, C2-VEC and C3-VEC migration, expressed as CI mean±SD (with samples assayed in quadruplicate), are shown. Blue lines: specific migration through FBS gradient; red lines, background migration. In B, horizontal bars are median, upper and lower edges of box are 75th and 25th percentiles, lines extending from box are 10th and 90th percentiles. *P<0.05 compared to control VEC.
Figure 6
Figure 6. Differential proliferation kinetics between control and pathological VEC.
Control and pathological VEC cells were seeded in fibronectin pre-coated 16 wells E-plates and monitored using the xCELLigence real time cell analyzer (RTCA). In A–B, cell proliferation was evaluated for all VEC samples and was expressed as cell index (CI) after normalization to the CI recorded at 4 hours. In A, representative panels of control-VEC, C2-VEC and C3-VEC proliferation, expressed as CI mean±SD (with samples assayed in quadruplicate), are shown. In B, horizontal bars are median, upper and lower edges of box are 75th and 25th percentiles, lines extending from box are 10th and 90th percentiles. *P<0.05 compared to control VEC. In C, data were generated by monitoring cell index in conditions of starvation (72 hours of serum and growth factor deprivation). *P<0.05 compared to control VEC.
Figure 7
Figure 7. Analysis of the NF-kB, OPG and VEGF levels in VEC culture supernatants and serum samples.
In A, NF-kB-p65 DNA binding activity was assessed in duplicate using the TransAM assay. Results are reported as absorbance values (O.D.) per 20 µg of cell lysate protein. In B, OPG and VEGF levels were determined by ELISA in VEC culture supernatants. In C, OPG and VEGF levels were determined by ELISA in sera of C2 and C3 patients as well as in sex and age-matched normal controls. In A–C, horizontal bars are median, upper, and lower edges of box are 75th and 25th percentiles; lines extending from box are 10th and 90th percentiles. *, P<0.05 compared to either control VEC (A–B) or control sera (C).

References

    1. Eberhardt RT, Raffetto JD. Chronic venous insufficiency. Circulation. 2005;111:2398–2409. - PubMed
    1. Parkington HC, Coleman HA, Tare M. Prostacyclin and endothelium dependent hyperpolarization. Pharmacol Res. 2004;49:509–514. - PubMed
    1. Levi M, Keller TT, van Gorp E, ten Cate H. Infection and inflammation and the coagulation system. Cardiovasc Res. 2003;60:26–39. - PubMed
    1. von Andrian UH, Mackay CR. T-Cell function and migration. Two sides of the same coin. N Engl J Med. 2000;343:1020–1034. - PubMed
    1. Ulbrich H, Eriksson EE, Lindbom L. Leukocyte and endothelial cell adhesion molecules as targets for therapeutic interventions in inflammatory disease. Trends Pharmacol Sci. 2003;24:640–647. - PubMed

Publication types

Substances