

Acetylcholinesterase deficiency contributes to neuromuscular junction dysfunction in type 1 diabetic neuropathy
- PMID: 22739110
- PMCID: PMC3423102
- DOI: 10.1152/ajpendo.00622.2011
Acetylcholinesterase deficiency contributes to neuromuscular junction dysfunction in type 1 diabetic neuropathy
Abstract
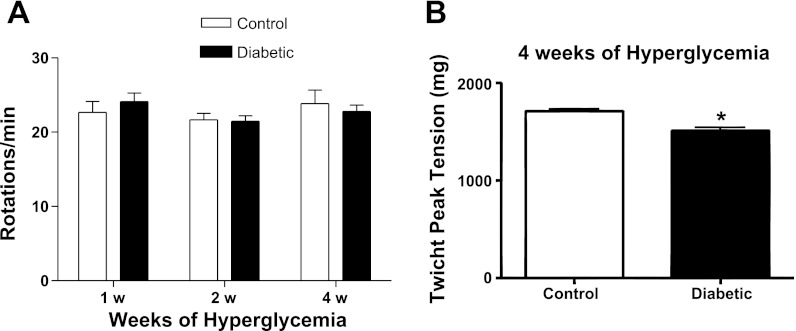
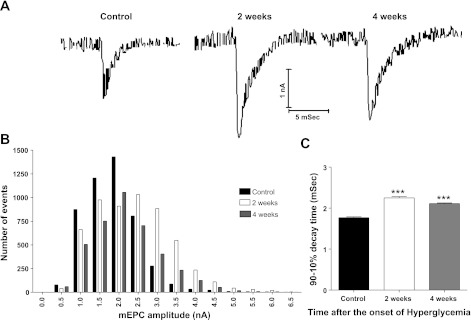
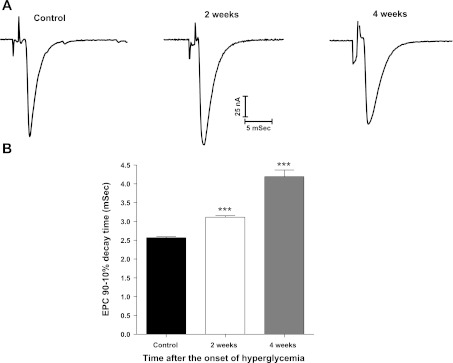
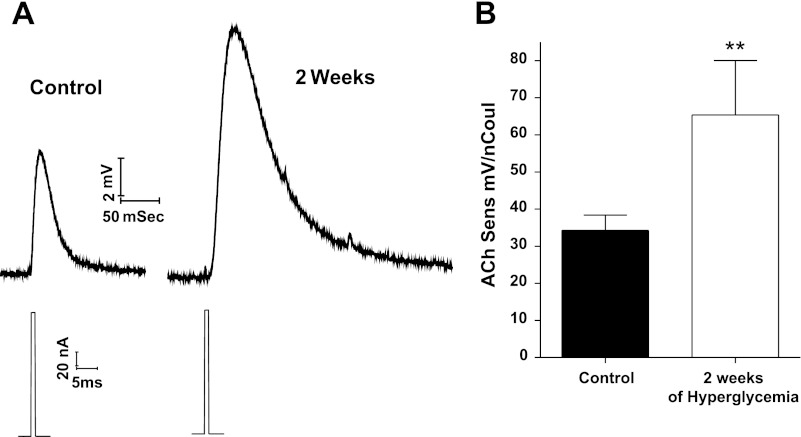
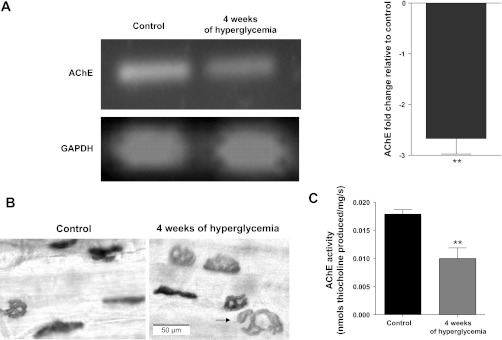
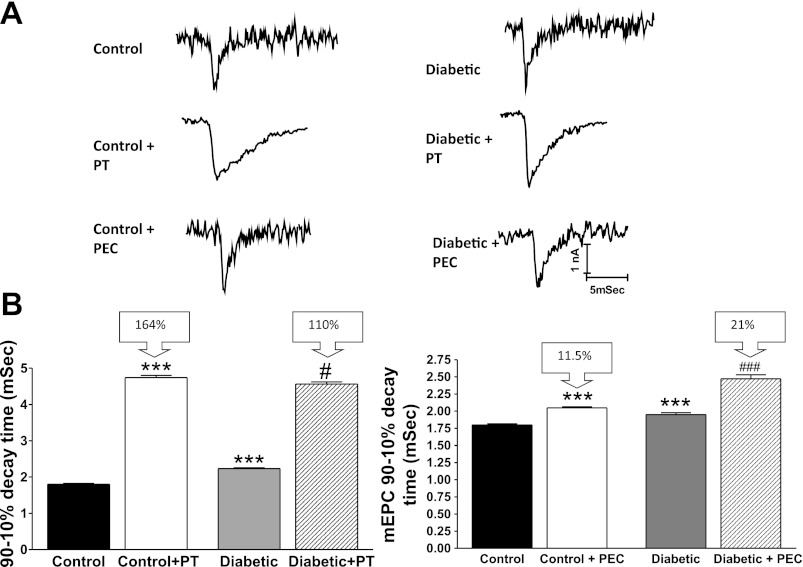
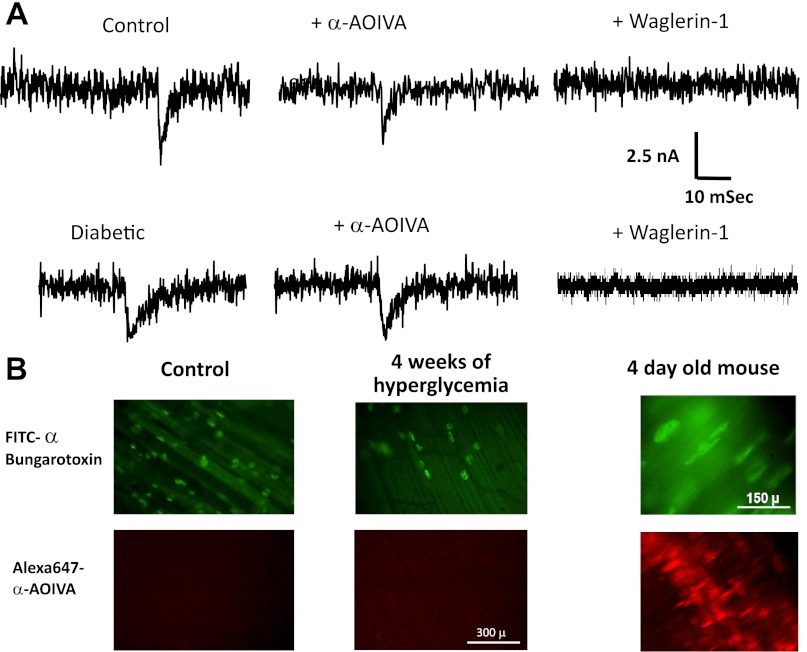
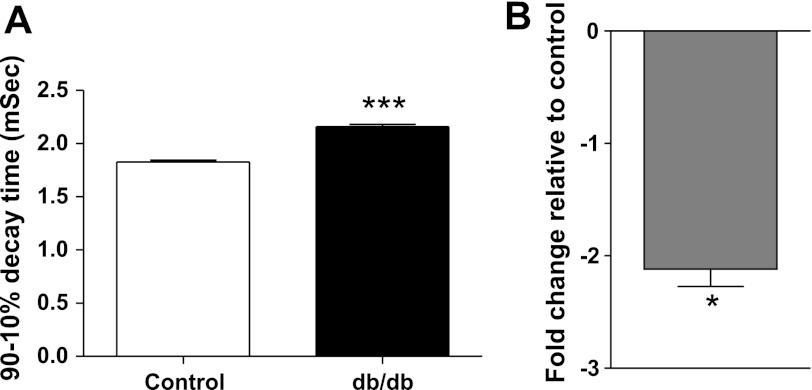
Diabetic neuropathy is associated with functional and morphological changes of the neuromuscular junction (NMJ) associated with muscle weakness. This study examines the effect of type 1 diabetes on NMJ function. Swiss Webster mice were made diabetic with three interdaily ip injections of streptozotocin (STZ). Mice were severely hyperglycemic within 7 days after the STZ treatment began. Whereas performance of mice on a rotating rod remained normal, the twitch tension response of the isolated extensor digitorum longus to nerve stimulation was reduced significantly at 4 wk after the onset of STZ-induced hyperglycemia. This mechanical alteration was associated with increased amplitude and prolonged duration of miniature end-plate currents (mEPCs). Prolongation of mEPCs was not due to expression of the embryonic acetylcholine receptor but to reduced muscle expression of acetylcholine esterase (AChE). Greater sensitivity of mEPC decay time to the selective butyrylcholinesterase (BChE) inhibitor PEC suggests that muscle attempts to compensate for reduced AChE levels by increasing expression of BChE. These alterations of AChE are attributed to STZ-induced hyperglycemia since similar mEPC prolongation and reduced AChE expression were found for db/db mice. The reduction of muscle end-plate AChE activity early during the onset of STZ-induced hyperglycemia may contribute to endplate pathology and subsequent muscle weakness during diabetes.
Figures
Similar articles
-
Butyrylcholinesterase and the control of synaptic responses in acetylcholinesterase knockout mice.Life Sci. 2007 May 30;80(24-25):2380-5. doi: 10.1016/j.lfs.2007.03.011. Epub 2007 Mar 28. Life Sci. 2007. PMID: 17467011
-
Butyrylcholinesterase and acetylcholinesterase activity and quantal transmitter release at normal and acetylcholinesterase knockout mouse neuromuscular junctions.Br J Pharmacol. 2003 Jan;138(1):177-87. doi: 10.1038/sj.bjp.0705010. Br J Pharmacol. 2003. PMID: 12522088 Free PMC article.
-
Interactions of edrophonium, physostigmine and methanesulfonyl fluoride with the snake end-plate acetylcholine receptor-channel complex.J Pharmacol Exp Ther. 1985 Sep;234(3):539-49. J Pharmacol Exp Ther. 1985. PMID: 2411911
-
The time course of miniature endplate currents and its modification by receptor blockade and ethanol.J Gen Physiol. 1984 Mar;83(3):435-68. doi: 10.1085/jgp.83.3.435. J Gen Physiol. 1984. PMID: 6325590 Free PMC article.
-
Naturally Occurring Genetic Variants of Human Acetylcholinesterase and Butyrylcholinesterase and Their Potential Impact on the Risk of Toxicity from Cholinesterase Inhibitors.Chem Res Toxicol. 2016 Sep 19;29(9):1381-92. doi: 10.1021/acs.chemrestox.6b00228. Epub 2016 Aug 31. Chem Res Toxicol. 2016. PMID: 27551784 Free PMC article. Review.
Cited by
-
Acupotomy Alleviates Energy Crisis at Rat Myofascial Trigger Points.Evid Based Complement Alternat Med. 2020 Feb 28;2020:5129562. doi: 10.1155/2020/5129562. eCollection 2020. Evid Based Complement Alternat Med. 2020. PMID: 32190087 Free PMC article.
-
Cholinesterases in Tripartite Neuromuscular Synapse.Front Mol Neurosci. 2021 Dec 23;14:811220. doi: 10.3389/fnmol.2021.811220. eCollection 2021. Front Mol Neurosci. 2021. PMID: 35002624 Free PMC article. Review.
-
Characterization of sensory and motor dysfunction and morphological alterations in late stages of type 2 diabetic mice.Front Endocrinol (Lausanne). 2024 Mar 11;15:1374689. doi: 10.3389/fendo.2024.1374689. eCollection 2024. Front Endocrinol (Lausanne). 2024. PMID: 38532899 Free PMC article.
-
Towards the Preparation of a Hydrogel from Lyophilisates of the Aloe arborescens Aqueous Extract.Pharmaceutics. 2022 Jul 18;14(7):1489. doi: 10.3390/pharmaceutics14071489. Pharmaceutics. 2022. PMID: 35890383 Free PMC article.
-
Effect of streptozotocin-induced diabetes on performance on a progressive ratio schedule.Psychopharmacology (Berl). 2014 Jun;231(12):2375-84. doi: 10.1007/s00213-013-3401-5. Epub 2014 Jan 9. Psychopharmacology (Berl). 2014. PMID: 24402135
References
-
- Abbott CA, Mackness MI, Kumar S, Olukoga AO, Gordon C, Arrol S, Bhatnagar D, Boulton AJ, Durrington PN. Relationship between serum butyrylcholinesterase activity, hypertriglyceridaemia and insulin sensitivity in diabetes mellitus. Clin Sci (Lond) 85: 77–81, 1993 - PubMed
-
- Adler M, Filbert MG. Role of butyrylcholinesterase in canine tracheal smooth muscle function. FEBS Lett 267: 107–110, 1990 - PubMed
-
- Adler M, Manley HA, Purcell AL, Deshpande SS, Hamilton TA, Kan RK, Oyler G, Lockridge O, Duysen EG, Sheridan RE. Reduced acetylcholine receptor density, morphological remodeling, and butyrylcholinesterase activity can sustain muscle function in acetylcholinesterase knockout mice. Muscle Nerve 30: 317–327, 2004 - PubMed
-
- Andersen H. Motor function in diabetic neuropathy. Acta Neurol Scand 100: 211–220, 1999 - PubMed
-
- Arendt T, Bruckner MK, Lange M, Bigl V. Changes in acetylcholinesterase and butyrylcholinesterase in Alzheimer's disease resemble embryonic development—a study of molecular forms. Neurochem Int 21: 381–396, 1992 - PubMed
Publication types
MeSH terms
Substances
Grants and funding
LinkOut - more resources
Full Text Sources
Other Literature Sources
Medical
Molecular Biology Databases
Miscellaneous