. 2012 Jun 28;3(6):e335.
doi: 10.1038/cddis.2012.77.

HtrA2 deficiency causes mitochondrial uncoupling through the F₁F₀-ATP synthase and consequent ATP depletion

Affiliations

HtrA2 deficiency causes mitochondrial uncoupling through the F₁F₀-ATP synthase and consequent ATP depletion

H Plun-Favreau et al. Cell Death Dis. .

Abstract

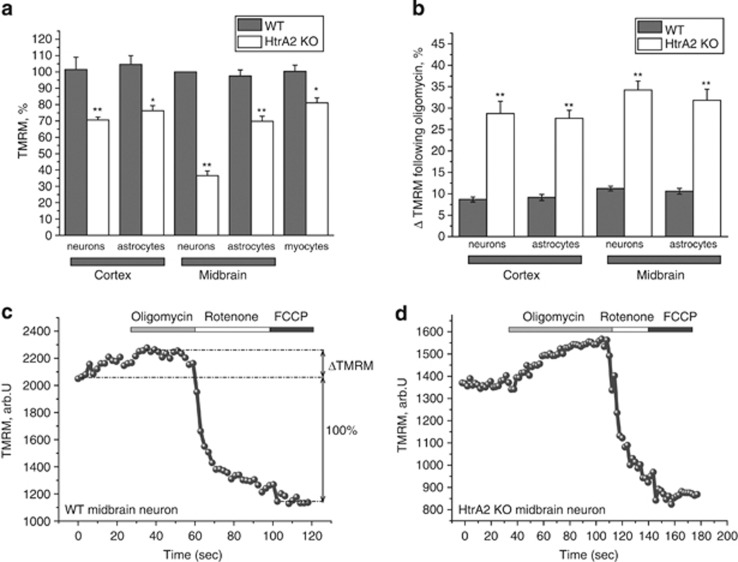
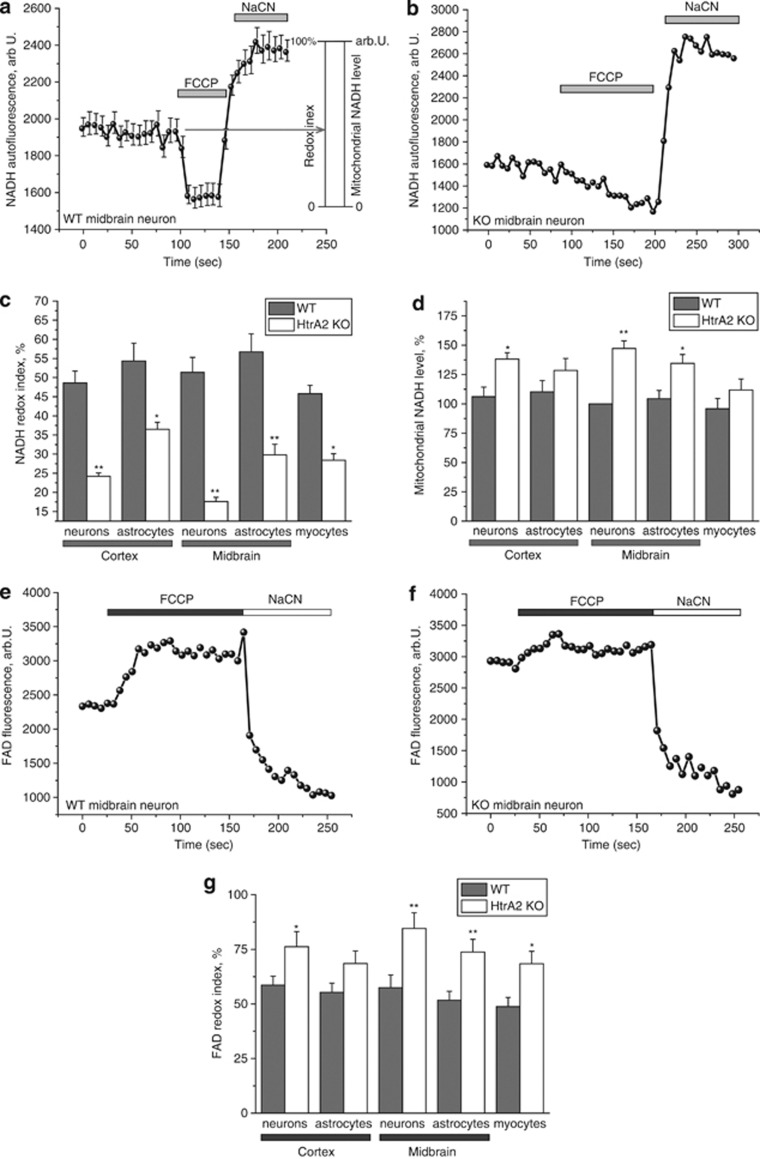
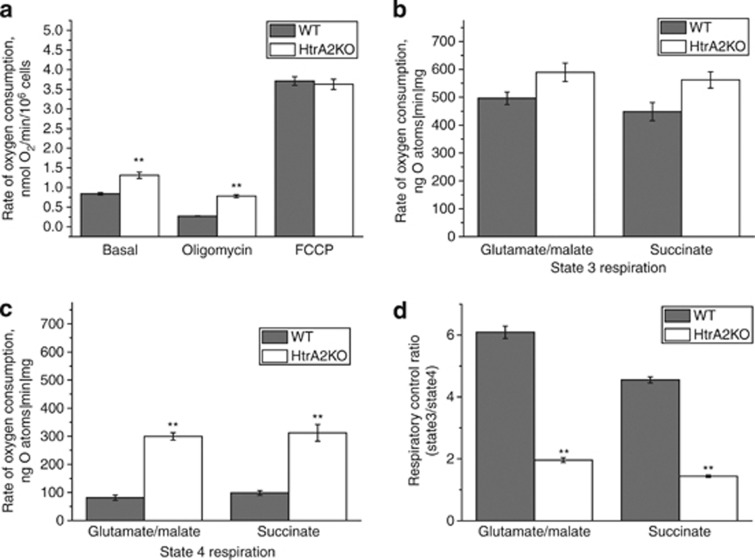
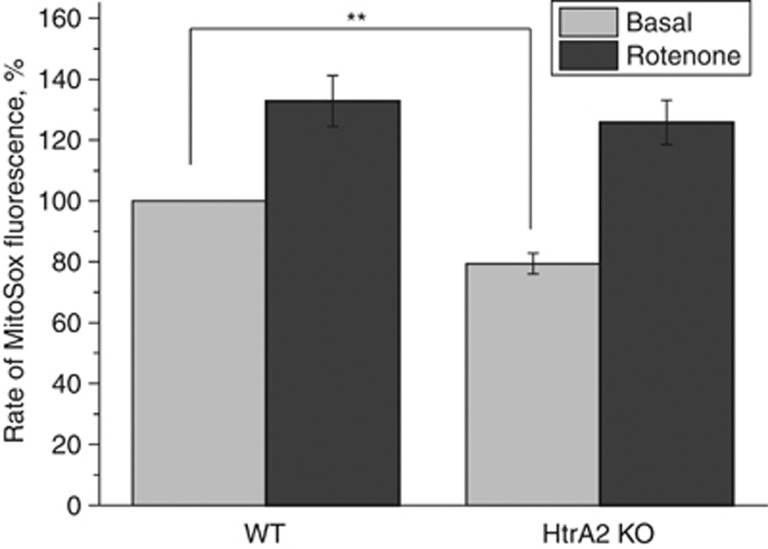
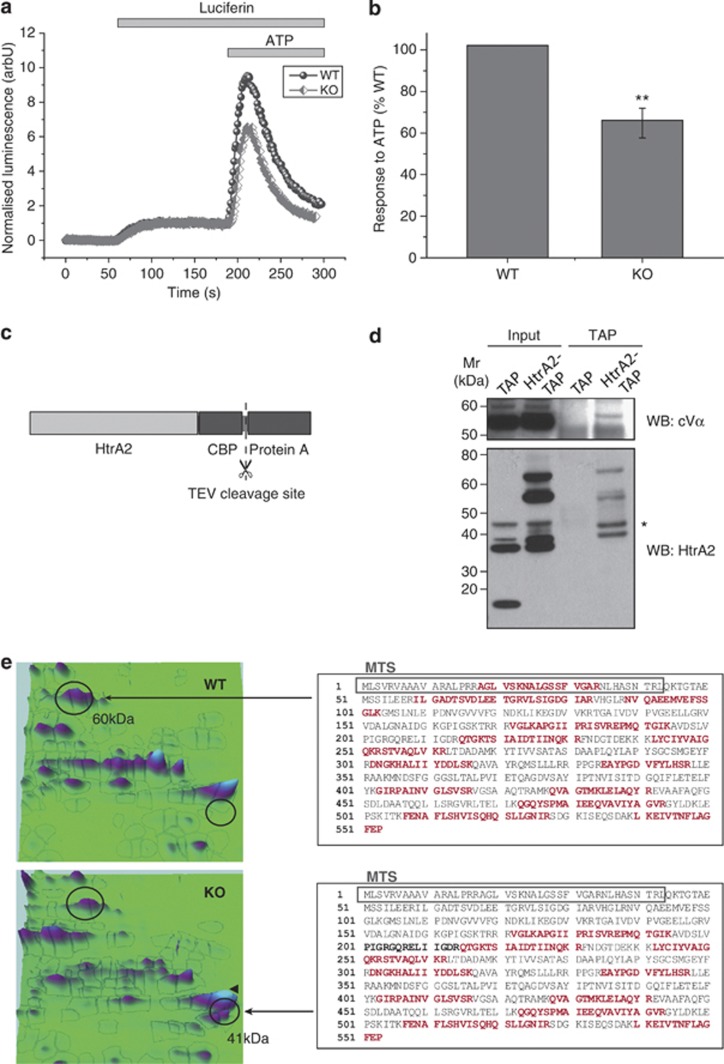
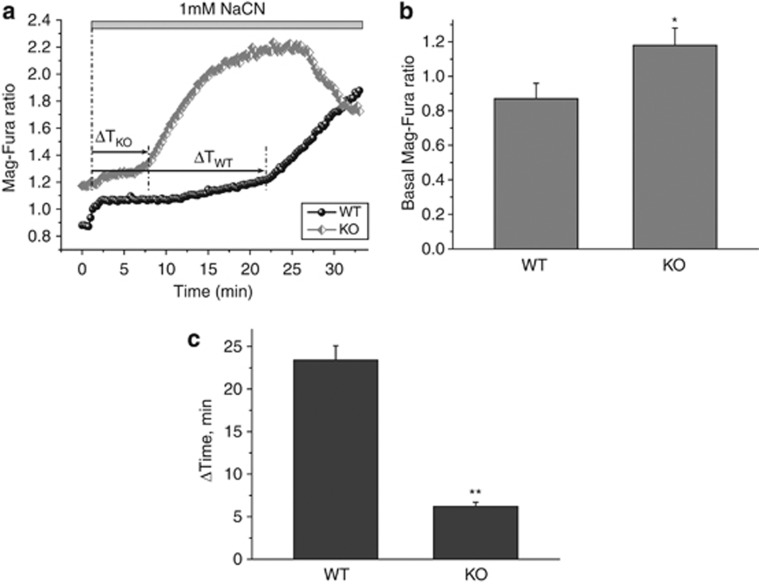
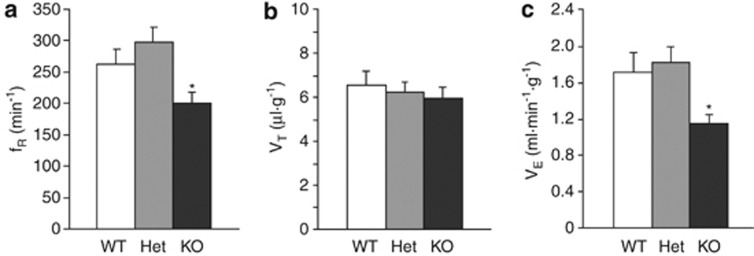
Loss of the mitochondrial protease HtrA2 (Omi) in mice leads to mitochondrial dysfunction, neurodegeneration and premature death, but the mechanism underlying this pathology remains unclear. Using primary cultures from wild-type and HtrA2-knockout mice, we find that HtrA2 deficiency significantly reduces mitochondrial membrane potential in a range of cell types. This depolarisation was found to result from mitochondrial uncoupling, as mitochondrial respiration was increased in HtrA2-deficient cells and respiratory control ratio was dramatically reduced. HtrA2-knockout cells exhibit increased proton translocation through the ATP synthase, in combination with decreased ATP production and truncation of the F1 α-subunit, suggesting the ATP synthase as the source of the proton leak. Uncoupling in the HtrA2-deficient mice is accompanied by altered breathing pattern and, on a cellular level, ATP depletion and vulnerability to chemical ischaemia. We propose that this vulnerability may ultimately cause the neurodegeneration observed in these mice.


Figures

Figure 1
Figure 1
Mitochondria are depolarised in HtrA2-deficient cells. (a) Mitochondrial membrane potiential was estimated by live cell imaging in a range of primary cell types using TMRM in redistribution mode (25 nM). Data are normalised to midbrain astrocytes (100%) and are represented as mean±S.E.M. (b) Mitochondrial hyperpolarisation (ΔTMRM) in response to oligomycin (2 μg/ml) is presented as a percentage of the difference between the initial TMRM fluorescence and the minimum TMRM fluorescence achieved after addition of FCCP (1 μM; see Figure 1c). (c and d) Representative TMRM traces for one WT (c) and one KO (d) midbrain neuron, showing responses to oligomycin (2 μg/ml), rotenone (5 μM) and FCCP (1 μM). In all cases, * indicates P<0.05 and ** indicates P<0.01 compared with WT values
Figure 2
Figure 2
Mitochondrial respiration is increased in HtrA2-deficient cells. (a) NADH autofluorescence was monitored in WT midbrain neurons by confocal microscopy. Addition of the uncoupler FCCP (1 μM) maximises mitochondrial respiration and thereby minimises mitochondrial NADH. NaCN (1 mM) was then added to block mitochondrial respiration and therefore maximise mitochondrial NADH. Redox index (the initial redox level expressed as a percentage of the range) and mitochondrial NADH level (the difference in absolute values between the minimum and maximum NADH autofluorescence) are described graphically. Data are represented as the mean of several cells on a single coverslip±S.E.M. (b) A representative trace is shown for a single HtrA2-KO midbrain neuron, demonstrating the smaller response to FCCP and larger response to NaCN in this cell compared with the WT (Figure 2a). (c) NADH redox index was calculated for a variety of primary cell types by calculating the initial NADH autofluorescence when the minimum NADH autofluorescence is normalised to 0% and the maximum to 100%. NADH redox index was reduced in all HtrA2-KO cell types but particularly in midbrain neurons. Data are represented as mean±S.E.M. (d) Mitochondrial NADH level was calculated as the difference in arbitrary units between the maximum and minimum NADH autofluorescence. Data were normalised to midbrain astrocytes (100%) and represented as mean±S.E.M. (e and f) FAD autofluorescence was monitored by confocal microscopy in WT (e) and HtrA2 KO (f) midbrain neurons. Addition of FCCP (1 μM) maximised respiration and therefore increased FAD autofluorescence to maximal levels. Addition of NaCN (1 mM) then inhibited respiration and reduced FAD autofluorescence to a minimum. Data shown are representative traces from single midbrain neurons. (g) FAD redox index was calculated for a range of primary cell types by normalising the FCCP response to 100% and the NaCN response to 0%. Data are represented as mean±S.E.M. In all cases, * indicates P<0.05 and ** indicates P<0.01 compared with WT values
Figure 3
Figure 3
Oxygen consumption is increased in HtrA2-deficient cells. (a) Oxygen consumption was measured in whole immortalised MEFs using a Clark oxygen electrode. Respiration was inhibited by blocking ATP production using oligomycin (2 μg/ml), and maximised by adding the uncoupler FCCP (1 μM). (b and c) Whole mitochondria were isolated from the brains of WT and HtrA2-KO mice and oxygen consumption was measured in state III (in which ADP is provided and respiration is coupled to oxidative phosphorylation), (b) and state IV (in which no ADP is present), (c). The experiment was performed in the presence of substrates for complex I (5 mM glutamate and 5 mM malate) or substrates for complex II (5 mM succinate in the presence of 5 μM rotenone). (d) RCR (ratio of state III to state IV respiration) was significantly reduced in mitochondria from the brains of HtrA2-KO mice compared with WT. Data is represented as mean±S.E.M. In all cases, * indicates P<0.05 and ** indicates P<0.01 compared with WT values
Figure 4
Figure 4
Mitochondrial ROS production is decreased in HtrA2-deficient cells. WT and HtrA2-KO midbrain cultures were loaded with MitoSOX (5 μM), an indicator of mitochondrial ROS production, and monitored by fluorescence microscopy. The rate of increase in MitoSOX fluorescence (indicating mROS production) was significantly reduced in HtrA2-KO cells compared with WT. Neurons of both genotypes responded equally to stimulation of ROS production using rotenone (5 μM). Data are represented as mean±S.E.M. ** Indicates P<0.05
Figure 5
Figure 5
The F1F0-ATP synthase is compromised in HtrA2-deficient cells. (a) ATP production was measured in live cells using a luciferin/luciferase based reporter assay. Immortalised MEFs transfected with cytosolic luciferase were perfused with luciferin (5 μM) followed by ATP (1 mM), which stimulates calcium uptake into mitochondria and therefore ATP production by the ATP synthase. Representative traces are shown for one WT and one KO coverslip. Initial luminescence is normalised to 0 and response to luciferin is normalised to 1. (b) ATP response curves were normalised to luciferin response as described, then for each pair of WT and KO coverslips the KO response was expressed as a percentage of the WT. Data are represented as mean±S.E.M. ** indicates P<0.01 compared with WT. (c) HtrA2 was tagged at the C terminus with a TAP tag consisting of a protein A sequence (for IP with IgG beads) and a calmodulin binding peptide (CBP) sequence (for IP with calmodulin resin) separated by a TEV cleavage site. (d) The F1 α-subunit (cVα) was identified in TAP eluates from HtrA2-TAP cells but not from TAP control cells. WB for HtrA2 shows endogenous processed HtrA2 (37 kDa) in TAP and HtrA2-TAP inputs, full-length and processed TAP-tagged HtrA2 (58 and 69 kDa) in the HtrA2-TAP inputs, and CBP-tagged processed HtrA2 (42 kDa) in the final eluate. * indicates a non-specific band. (e) A 2D-PAGE analysis of protein expression in WT and HtrA2-KO MEFs indicated a significant reduction in the peak corresponding to the α-subunit of the ATP synthase (60 kDa), and the appearance of a further peak identified by mass spectrometry as a truncated form of this subunit (41 kDa). The identified fragments are highlighted on the full length sequence of the α-subunit in red. In the truncated subunit good sequence coverage was obtained for the C-terminus but not the N-terminus of the protein, suggesting that truncation may remove the MTS (grey box)
Figure 6
Figure 6
HtrA2 deficiency leads to ATP depletion and vulnerability to chemical ischaemia. (a–c) ATP levels were assessed indirectly using an indicator of free magnesium, Mag-Fura (5 μM). (a) shows representative traces for one WT and one HtrA2-KO midbrain neuron. Initial Mag-Fura ratio was significantly higher in HtrA2 KO traces than in WT (quantified in (b), data represented as mean±S.E.M.), indicating lower ATP levels in these cells. Inhibition of mitochondrial respiration by NaCN (1 mM) causes a slow increase in Mag-Fura ratio as ATP levels are depleted, followed by a sudden increase in Mag-Fura ratio as ATP levels are insufficient to maintain ionic homoeostasis and the cell floods with calcium. The time to onset of this bioenergetic collapse is significantly shorter in the HtrA2-KO neurons compared with WT (quantified in (c), data represented as mean±S.E.M.), indicating increased vulnerability to chemical ischaemia. * Indicates P<0.05, ** indicates P<0.01.
Figure 7
Figure 7
Whole animal respiration is reduced in HtrA2-deficient mice. Respiratory rate (fR) and tidal volume (VT) were assessed by whole-body plethysmography in conscious WT, heterozygous and HtrA2-KO mice aged P20. (ac) Respiratory rate (a) was reduced in HtrA2-KO mice compared with their WT and heterozygous counterparts, but tidal volume (b) was unchanged. Minute ventilation (VE), calculated as the product of fR and VT, was therefore significantly reduced in HtrA2-KO animals (c). Data are represented as mean±S.E.M., * indicates P<0.05

References

    1. Vande Walle L, Lamkanfi M, Vandenabeele P. The mitochondrial serine protease HtrA2/Omi: an overview. Cell Death Differ. 2008;15:45s3–460. - PubMed
    1. Martins LM, Morrison A, Klupsch K, Fedele V, Moisoi N, Teismann P, et al. Neuroprotective role of the Reaper-related serine protease HtrA2/Omi revealed by targeted deletion in mice. Mol Cell Biol. 2004;24:9848–9862. - PMC - PubMed
    1. Strauss KM, Martins LM, Plun-Favreau H, Marx FP, Kautzmann S, Berg D, et al. Loss of function mutations in the gene encoding Omi/HtrA2 in Parkinson's disease. Hum Mol Genet. 2005;14:2099–2111. - PubMed
    1. Bogaerts V, Nuytemans K, Reumers J, Pals P, Engelborghs S, Pickut B, et al. Genetic variability in the mitochondrial serine protease HTRA2 contributes to risk for Parkinson disease. Hum Mutat. 2008;29:832–840. - PubMed
    1. Kieper N, Holmstrom KM, Ciceri D, Fiesel FC, Wolburg H, Ziviani E, et al. Modulation of mitochondrial function and morphology by interaction of Omi/HtrA2 with the mitochondrial fusion factor OPA1. Exp Cell Res. 2010;316:1213–1224. - PMC - PubMed

Publication types

MeSH terms

Substances