. 2012 Dec 15;520(18):4275-93.
doi: 10.1002/cne.23176.

"Late" macroendosomes and acidic endosomes in vertebrate motor nerve terminals

Affiliations

"Late" macroendosomes and acidic endosomes in vertebrate motor nerve terminals

Richard S Stewart et al. J Comp Neurol. .

Abstract

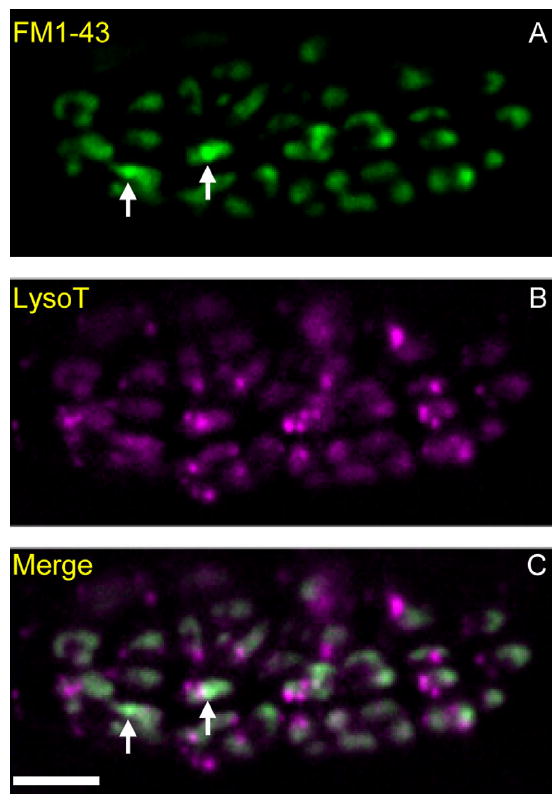
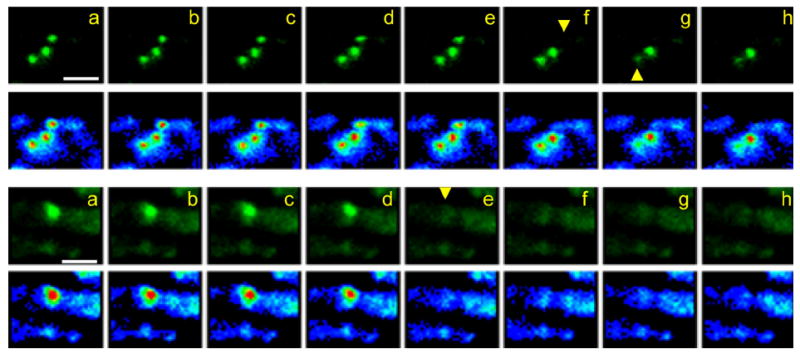
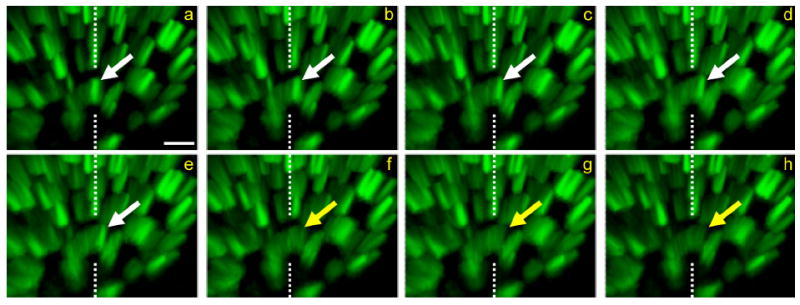
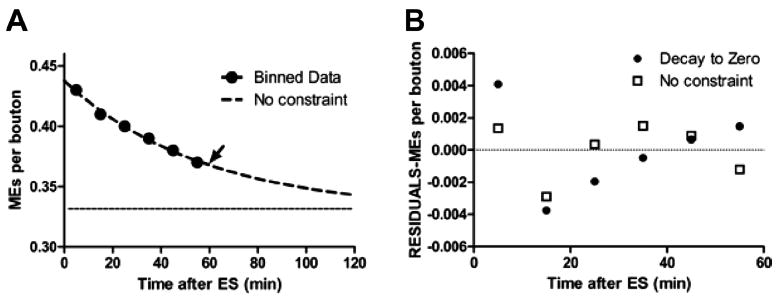
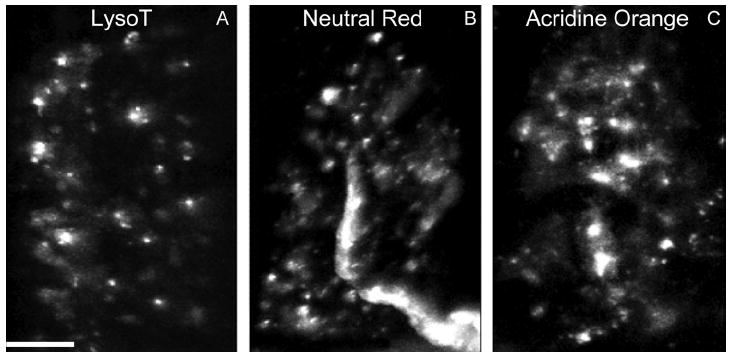
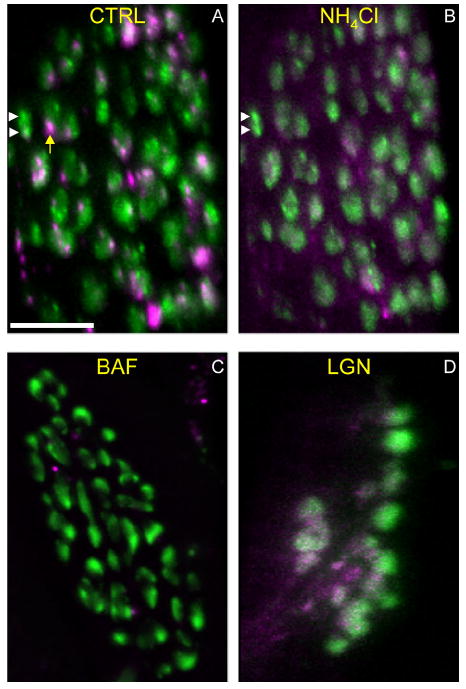
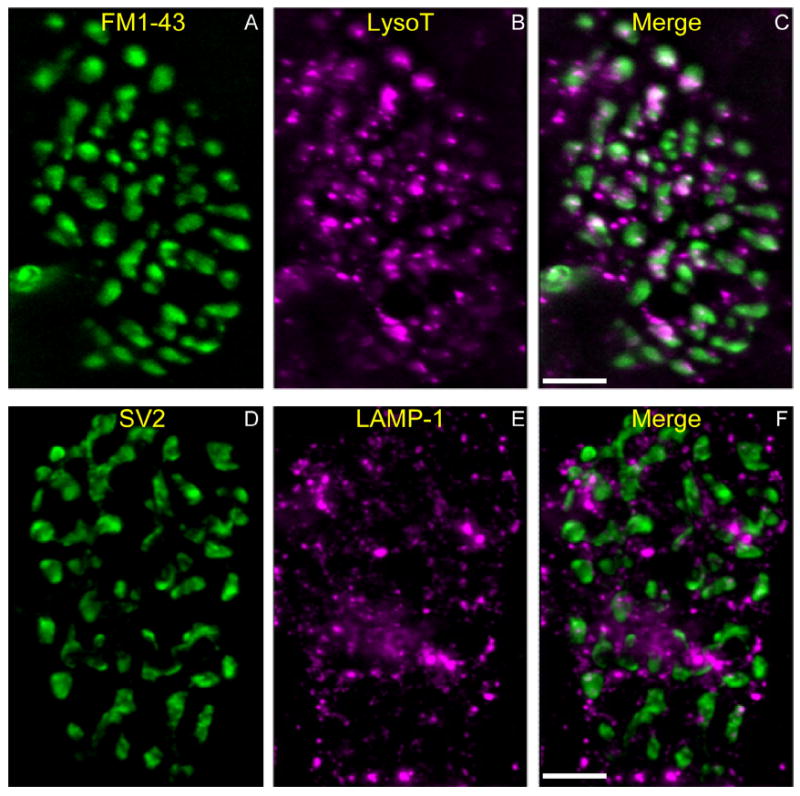
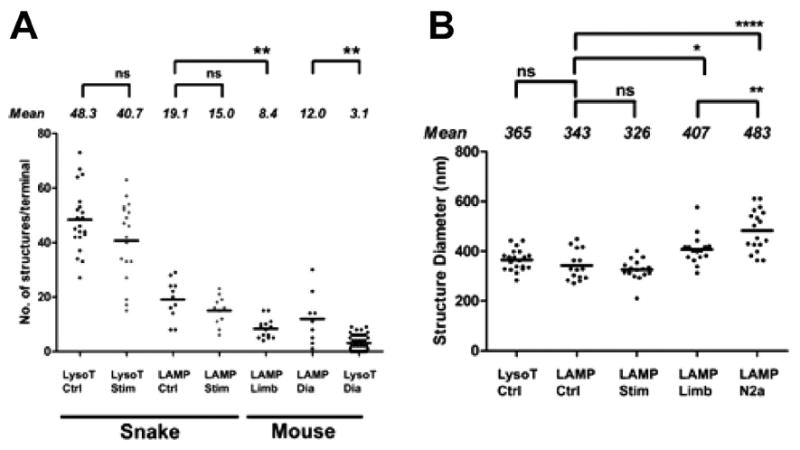
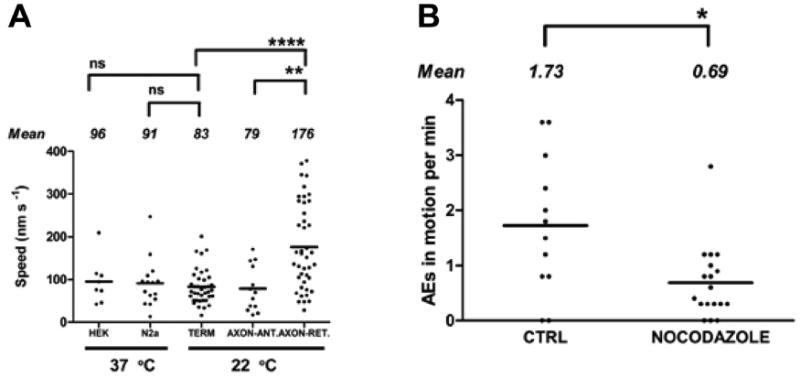
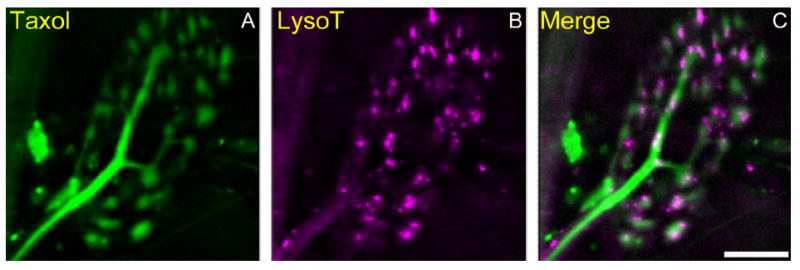
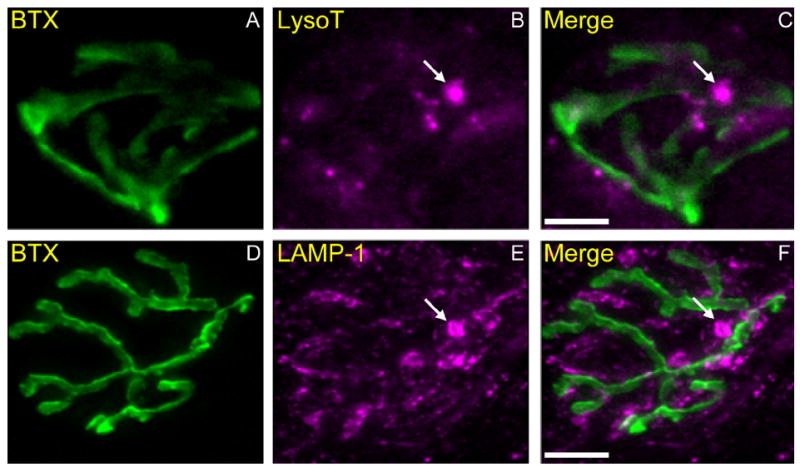
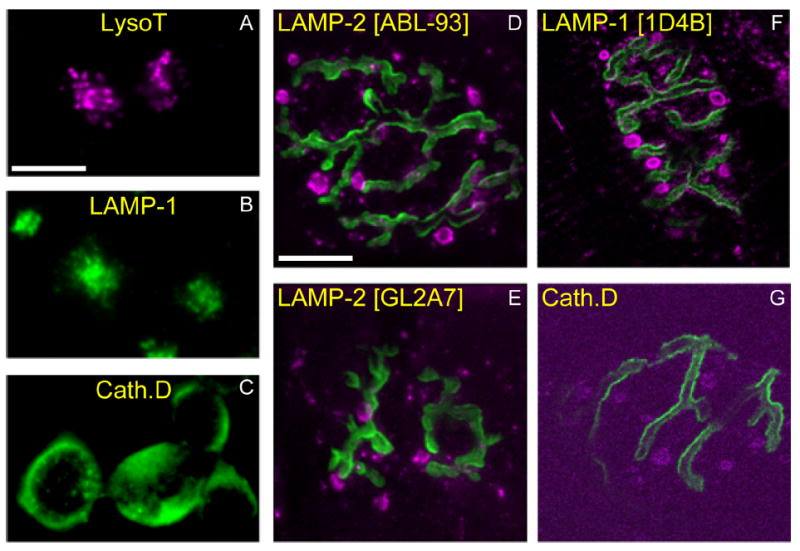
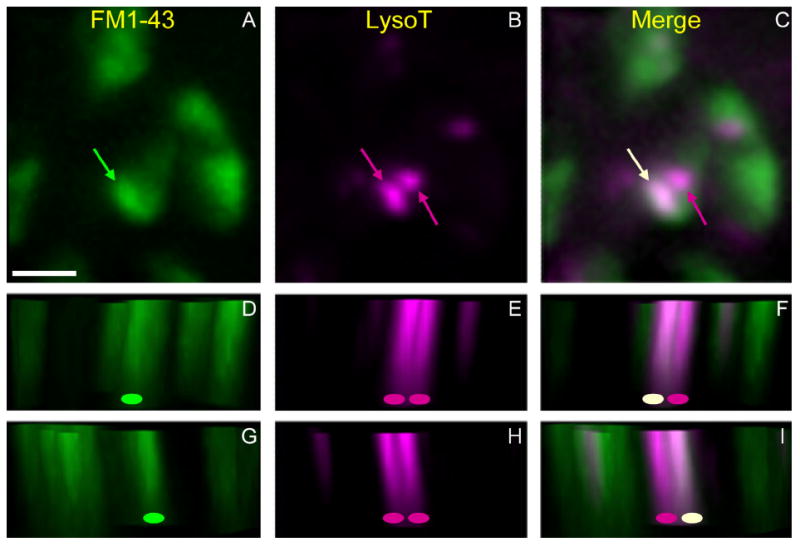
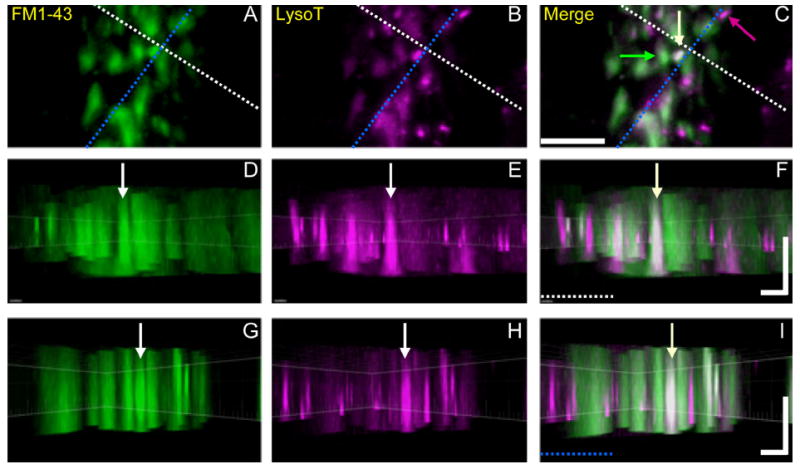
Activity at the vertebrate nerve-muscle synapse creates large macroendosomes (MEs) via bulk membrane infolding. Visualized with the endocytic probe FM1-43, most (94%) of the ∼25 MEs/terminal created by brief (30-Hz, 18-second) stimulation dissipate rapidly (∼1 minute) into vesicles. Others, however, remain for hours. Here we study these "late" MEs by using 4D live imaging over a period of ∼1 hour after stimulation. We find that some (51/398 or 13%) disappear spontaneously via exocytosis, releasing their contents into the extracellular milieu. Others (at least 15/1,960 or 1%) fuse or closely associate with a second class of endosomes that take up acidophilic dyes (acidic endosomes [AEs]). AEs are plentiful (∼47/terminal) and exist independent of stimulation. Unlike MEs, which exhibit Brownian motion, AEs exhibit directed motion (average, 83 nm/sec) on microtubules within and among terminal boutons. AEs populate the axon as well, where movement is predominantly retrograde. They share biochemical and immunohistochemical markers (e.g., lysosomal-associated membrane protein [LAMP-1]) with lysosomes. Fusion/association of MEs with AEs suggests a sorting/degradation pathway in nerve terminals wherein the role of AEs is similar to that of lysosomes. Based on our data, we propose that MEs serve as sorting endosomes. Thus their contents, which include plasma membrane proteins, vesicle proteins, and extracellular levels of Ca(2+) , can be targeted either toward the reformation and budding of synaptic vesicles, toward secretion via exocytosis, or toward a degradation process that utilizes AEs either for lysis within the terminal or for transport toward the cell body.


Conflict of interest statement

CONFLICT OF INTEREST STATEMENT

The authors have no competing interests to declare.

Figures

Figure 1
Figure 1
Macroendosomes (MEs) and acidic endosomes (AEs) in a snake motor nerve terminal. A–C: Preparations were incubated with LysoTracker (B; magenta), rinsed, and then electrically stimulated with bath-applied FM1-43 (A; green; C is merged). Punctate acidic endosomes (AEs, magenta in B and C) are visible throughout the terminal. Two macroendosomes (MEs, green) are marked with arrows in A and C. Background FM1-43 “haze” (green) obscures MEs and is due to recently endocytosed 50-nm vesicles that also contain FM1-43. Scale bar = 10 μm in C (applies to A–C).
Figure 2
Figure 2
MEs vanish between sequential time-lapse frames. Shown are two examples of living terminals stimulated with bath-applied FM1-43 as in Figure 1. a–h, Top: Time-lapse views of consecutive frames from a 4D sequence (interval, 40 seconds), are presented from left to right. Images are compressed from z-stacks (six image planes, 1.5-μm spacing) and magnified such that only one of ~60 terminal boutons is in view. Each sequence is shown normally (green; upper images in each pair) and in pseudocolor (red, yellow, green, blue, purple in order of decreasing brightness). Yellow arrowheads indicate disappearance of two MEs whereas a third, between them, remains. a–h, Bottom: A single ME disappears from a bouton. Recording parameters are as described above except frame interval is 1 minute. Scale bar = 5 μm in a (applies to a–h).
Figure 3
Figure 3
Exocytosis of MEs continues long after stimulation. Time-lapse sequence of disappearing ME. The preparation was briefly stimulated with bath-applied FM1-43. a–h: Eight sequential frames from a 4D data set (six image planes, 1.5-μm spacing, 1-minute interval). The arrow follows the lateral movement and disappearance (indicated by change of arrow color from white to yellow) of one ME between frames e and f, approximately 55 minutes after stimulation. The dashed lines reference the position of the ME in frame a. At light-level resolution, the ME disappears as it contacts the membrane, consistent with exocytosis. The terminal is viewed obliquely (Imaris software) so that both the x-y plane and the z-axis depth can be appreciated. Scale bar = 1 μm in a (applies to a–h).
Figure 4
Figure 4
The macroendosome (ME) exocytosis rate decays exponentially to a plateau. A: The total number of MEs remaining as function of time after electrical stimulation (ES) was compiled from all 4D data sets. Data were binned into 10-minute intervals (black circles). The frequency of exocytic events is best fit by a single exponential (dashed line; arrow indicates the time constant at 58 minutes) that decays to a plateau (dotted line) of 0.33 MEs/bouton, or 20 MEs per average-sized terminal. B: Residual analyses of Gaussian least-squares fits to unconstrained exponential in A versus fit to exponential constrained to decay to zero MEs/bouton. Note systematic error in constrained fit (linear trend in filled circles).
Figure 5
Figure 5
AEs are recognized by conventional supravital acidophilic probes. A–C: Living snake nerve–muscle preparations were incubated with Neutral Red (B) or Acridine Orange (C; both 1 μg/ml, 30 minutes), followed by washing with reptilian saline and imaging as in Figure 4. Characteristics of the small puncta (white) stained by the dyes are similar to LysoTracker-positive structures (AEs) (compare with A; see also Fig. 1B). Scale bar = 10 μm in A (applies to A–C).
Figure 6
Figure 6
AEs are deacidified by agents that disrupt lysosomal function. Preparations were incubated with LysoTracker and then depolarized with potassium chloride (KCl; 60 mM, 3 minutes) in the presence of FM1-43. A: Control (CTRL) showing MEs (green; white arrowheads) and AEs (magenta; yellow arrow) in a typical terminal. Green background is 50-nm vesicles endocytosed during the stimulation. B: The same preparation in A was treated with ammonium chloride (NH4Cl; 50 mM, 15 minutes) and reimaged. The LysoTracker signal is largely abolished, indicating pH increase or other disruption within AEs. MEs (white arrowheads) and vesicle haze were unaffected by the treatment. C,D: Additional preparations were incubated with LysoTracker and FM1-43 as above, and were then incubated with 20 nM Bafilomycin (BAF; C) or 0.5 mM Leu-Gly-β-naphthylamide (LGN; D) for 30 minutes and reimaged in the presence of the drug. Most of the LysoTracker-positive structures (AEs) were no longer visible. Each image is compressed from a z-stack (maximum-z projection). Scale bar = 10 μm in A (applies to A–D).
Figure 7
Figure 7
LAMP-1–positive structures in fixed snake terminals resemble living AEs. A–C: Living snake terminal labeled with FM1-43 (A; green) by KCl depolarization (60 mM, 3 minutes) to reveal location of bouton vesicular compartment. AEs are labeled with LysoTracker (B; magenta). Merged image (C) indicates that most AEs are within boutons but not within the vesicular compartments. Note AEs in axon (entering at the lower left). The axon (green) is labeled by FM1-43 because of the dye’s affinity to myelin membrane. D–F: Another snake terminal fixed and immunostained with the synaptic vesicle marker SV2 (D; green) to reveal vesicular compartments. The terminal is also stained with anti-LAMP-1 (Sigma), a marker for lysosomes (E; magenta; F is merged). Note the similar size and number of LysoTracker and LAMP-1–positive vesicles (compare B and E), and the similar distributions of LAMP-1 and LysoTracker mainly outside the vesicular compartment (compare C and F). Scale bar = 10 μm in C (applies to A–C) and F (applies to D–F).
Figure 8
Figure 8
Properties of AEs in snake and mouse terminals. A: The number of living AEs in both snake and mouse (see Fig. 11) terminals decreased slightly, but not significantly, after depolarization of the terminal with KCl (Stim) (60 mM, 2 minutes). AEs in living snake terminals were more numerous than detectable LAMP-1–positive structures viewed after fixation. In contrast, detectable living AEs in mouse terminals (limb and diaphragm) were less numerous than LAMP-1–positive structures (see text). Comparisons marked ** were significant (P = 0.001). B: Size of snake AEs viewed at light level did not differ significantly between living (LysoT) and fixed (LAMP) preparations. Size did not change significantly after KCl depolarization (Stim; 60 mM, 2 minutes). Both snake and mouse (LAMP Limb) AEs were significantly smaller than anti-LAMP-1–positive lysosomes in N2a (mouse neuroblastoma) cells (****, P < 0.0001; **, P = 0.008; *, P = 0.01; ns, not significant). Means for each condition are indicated by solid lines.
Figure 9
Figure 9
AE velocities in axons and terminals. A: Time-lapse sequences were analyzed to determine distance traveled per unit time. Directed movement of AEs within snake terminals (TERM), and within the motor axon moving toward the terminal (AXON-ANT), did not differ significantly from directed movement of lysosomes within HEK (human embryonic kidney) and N2a cells. Movement of AEs within the axon and directed toward the cell body (AXON-RET) was significantly faster (****, P < 0.0001; **, P = 0.002; ns, not significant). B: Treatment with nocodazole (20 μM, 2 hours) partially inhibits movement of AEs. The number of moving AEs (shown normalized per minute of observation) observed over identical 20X 10-seconds time-lapse records in treated versus control preparations decreased significantly (*, P = 0.02). Means for each condition are indicated by solid lines.
Figure 10
Figure 10
Some but not all AEs are associated with microtubules. A–C: Living snake terminals were incubated with Oregon green 488–taxol (A; green) and LysoTracker (B; magenta) and imaged as in Figure 6 (maximum z projection). Taxol-labeled tubulin was most visible within the axon and within thin connectives between terminal boutons. Note the close association of several AEs with the tubulin arbor (C; merged). Scale bar = 10 μm in C (applies to A–C).
Figure 11
Figure 11
AEs are found within mouse motor terminals. A–C: Neuromuscular junctions (NMJs) in living mouse diaphragm incubated with 488-Bungarotoxin (BTX; 0.5 μg/ml, 30 minutes, 37°C) to label postsynaptic acetylcholine receptors (nAChRs) that appose the vesicular compartment of the terminal (A; green). The preparation was simultaneously incubated with LysoTracker (B; magenta), and then imaged as in Figure 4 (maximum z projection). Several small LysoTracker-positive AEs are visibly aligned with AChRs and presumably within the terminal (C; merged). In addition, there are occasional much larger acidic structures within or adjacent to the terminal that are absent from snake NMJs (arrow in B and C; compare with Fig. 7B). D–F: NMJs in fixed mouse muscle (gastrocnemius) immunostained with 488–bungarotoxin (D; green) and LAMP-1 (Sigma) antibody (E; magenta) as in Figure 7D-F. Note the presence of very large (>1-μm diameter) LAMP-1–positive structures (arrows in E and F) near the NMJs, in addition to more regularly sized (300–500 nm) LAMP-1–positive structures. Size and number distributions of mouse AEs are shown in Figure 8. Scale bar = 10 μm in C (applies to A–C) and F (applies to D–F).
Figure 12
Figure 12
AEs contain lysosomal marker proteins. A–C: Mouse neuroblastoma (N2a) cells were incubated vitally with LysoTracker (A; magenta), or fixed and immunostained with an antibody against LAMP-1 (1D4B) (B; green) or Cathepsin D (C; green). As expected, small (300–500-nm) vesicles (lysosomes) are seen concentrated near the nuclear compartment. D–G: Mouse muscles (gastrocnemius) were incubated with 488–Bungarotoxin (green) to identify AChRs apposing motor terminals and fixed. Immunostaining with antibodies against various lysosomal proteins (magenta; specific antibodies indicated at top of each panel) revealed a pattern similar to LysoTracker staining of AEs (see Fig. 11F), including large structures outside the terminal. Scale bar = 10 μm in A (applies to A–C) and D (applies to D–G).
Figure 13
Figure 13
Some MEs internalized by stimulation appear to fuse with preexisting AEs. Preparations were incubated with LysoTracker to label AEs (magenta), rinsed, and then stimulated with FM1-43 to create and label MEs (green). Shown is a small region of one terminal (four boutons) imaged in three dimensions (eight image planes, 0.55 μm per plane). A–C: Normal x–y view. The compressed image stacks show vesicle haze, one FM1-43-labeled structure (A, green arrow), and two LysoTracker-labeled structures (B, magenta arrows). Merged image (C) reveals that ME and leftmost AE are fused (white arrow; magenta arrow is the other AE). D–I: lateral views of image stack with z-axis vertical (green oval, ME; magenta oval, AE; off-white oval, fused; see Materials and Methods). The view is of parallel slices along a diagonal line, from the lower left to the upper right in x–y panels and either just below (D–F) or just above (G–I) the fused endosome. Note colocalization of green and magenta voxels (white or near-white) for the fused endosome when viewed from either direction. Scale bar = 5 μm in A (applies to A–I).
Figure 14
Figure 14
Orthogonal views of voxels representing putative ME-AE fusion events. Snake nerve–muscle preparations were incubated in LysoTracker and stimulated with FM1-43 and imaged as in Figure 13 (13 image planes, 0.55 μm per plane). A–C: Conventional views show part of a nerve terminal whose boutons contain MEs, AEs, and at least one putative fusion event (white arrow in C). The orthogonal dashed lines just above (white) and to the right (blue) of the yellow endosome indicate the orientation of z-slices shown in the side-view panels below (note dashed colored lines in F and I), and also indicate the location of the fused endosome as it appears in the left (FM1-43, green) and center (LysoTracker, magenta) panels. D–F: Slice view in a plane whose horizontal dimension is along the white dashed line in A–C, and whose vertical dimension is along the z-axis. G–I: Slice view along the blue line in A–C. Thus each vertical column depicts the fused endosome (vertical arrows) in all three orthogonal planes, indicating that magenta and green voxels are colocalized (white or near-white). Image was processed by using Imaris Bitplane software (see Materials and Methods). Scale bar = 5 μm in C (applies to A–C); 2 μm (horizontal) and 3 μm (vertical) in F (applies to D–F) and I (applies to G–I).

Similar articles

Cited by

References

    1. Agulhon C, Rostaing P, Ravassard P, Sagne C, Triller A, Giros B. Lysosomal amino acid transporter LYAAT-1 in the rat central nervous system: an in situ hybridization and immunohistochemical study. J Comp Neurol. 2003;462:71–89. - PubMed
    1. Andrejewski N, Punnonen E-L, Guhde G, Tanaka Y, Lullmann-Rauchl R, Hartmann D, von Figura K, Saftig P. Normal lysosomal morphology and function in LAMP-1-deficient mice. J Biol Chem. 1999;274:12692–12701. - PubMed
    1. Banks P, Mayor D, Owen T. Effects of low temperatures on microtubules in the non-myelinated axons of post-ganglionic sympathetic nerves. Brain Res. 1975;83:277–292. - PubMed
    1. Blumstein J, Faundez V, Nakatsu F, Saito T, Ohno H, Kelly RB. The neuronal form of adaptor protein-3 is required for synaptic vesicle formation from endosomes. J Neurosci. 2001;21:8034–8042. - PMC - PubMed
    1. Boonen M, van Meel E, Oorschot V, Klumperman J, Kornfeld S. Vacuolization of mucolipidosis type II mouse exocrine gland cells represents accumulation of autolysosomes. Mol Biol Cell. 2011;22:1135–1147. - PMC - PubMed

Publication types

MeSH terms