

Association between Tp-e/QT ratio and prognosis in patients undergoing primary percutaneous coronary intervention for ST-segment elevation myocardial infarction
- PMID: 22740086
- PMCID: PMC6652422
- DOI: 10.1002/clc.22022
Association between Tp-e/QT ratio and prognosis in patients undergoing primary percutaneous coronary intervention for ST-segment elevation myocardial infarction
Abstract
Background: Both the Tpeak-Tend interval (Tp-e) and the Tp-e/QT ratio have been linked to increased risk for arrhythmia. Patient Tp-e/QT ratios were investigated prior to primary percutaneous coronary intervention (pPCI) in patients with ST-segment elevation myocardial infarction (STEMI).
Hypothesis: Tp-e/QT ratio maybe associated with the prognosis in patients with ST-segment elevation.
Methods: A total of 338 patients (N = 338) with STEMI treated by pPCI were included. The Tp-e and Tp-e/QT ratio were determined using electrocardiograms in the subjects exhibiting ST-segment elevation.
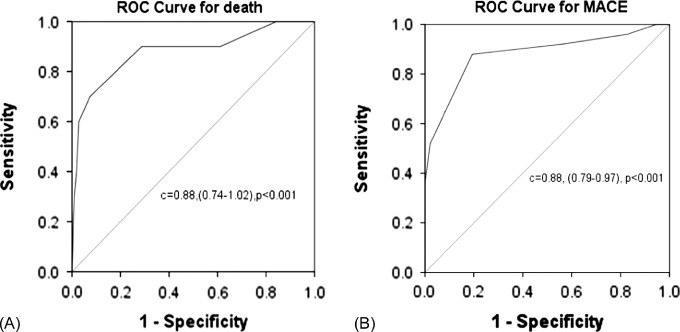
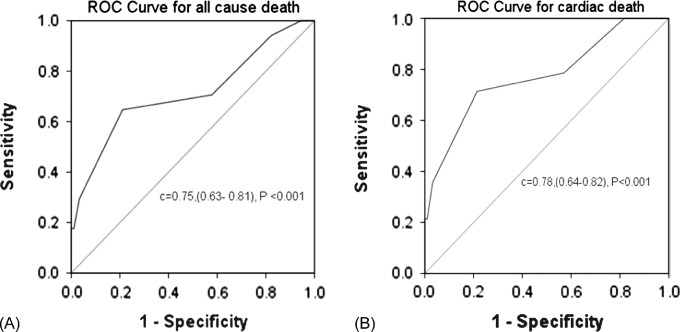
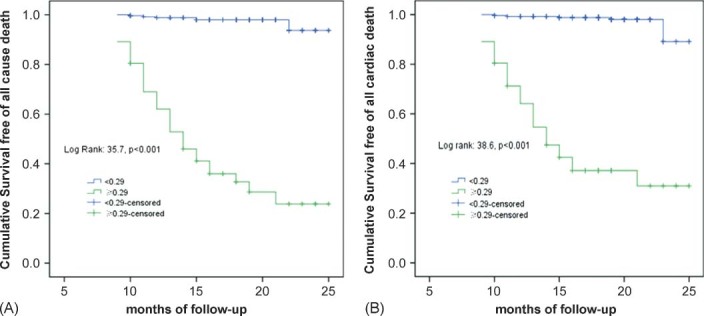
Results: The Tp-e/QT ratio was correlated with both short- and long-term outcomes. Analysis of the receiver operating characteristic curve demonstrated that the optimal cutoff value for outcome prediction was a Tp-e/QT ratio of 0.29. Of the 388 patients enrolled, 115 (34.0%) exhibited a Tp-e/QT ratio ≥ 0.29. Patients with a Tp-e/QT ratio ≥ 0.29 showed elevated rates of both in-hospital death (21.9% vs 2.3%; P < 0.001) and main adverse cardiac events (MACE) (48.1% vs 15.3%; P < 0.005). After discharge, Tp-e/QT ratios ≥ 0.29 remained an independent predictor of all-cause death (35.5% vs 5.2%, P < 0.001) and cardiac death (32.3% vs 2.6%, P < 0.001).
Conclusions: The Tp-e/QT ratio may serve as a prognostic predictor of adverse outcomes after successful pPCI treatment in STEMI patients.
© 2012 Wiley Periodicals, Inc.
Figures
References
-
- Cannon CP, Greenberg BH. Risk stratification and prognostic factors in the post‐myocardial infarction patient. Am J Cardiol. 2008;102:13G–20G. - PubMed
-
- Kuriachan V, Exner DV. Role of risk stratification after myocardial infarction. Curr Treat Options Cardiovasc Med. 2009;11:10–21. - PubMed
-
- Dekker JM, Crow RS, Hannan PJ, et al. Heart rate‐corrected QT interval prolongation predicts risk of coronary heart disease in black and white middle‐aged men and women: the ARIC study. J Am Coll Cardiol. 2004;43:565–571. - PubMed
-
- Goldenberg I, Mathew J, Moss AJ, et al. Corrected QT variability in serial electrocardiograms in long QT syndrome: the importance of the maximum corrected QT for risk stratification. J Am Coll Cardiol. 2006;48:1047–1052. - PubMed
Publication types
MeSH terms
LinkOut - more resources
Full Text Sources
Medical
