. 2012 Aug;61(8):2016-29.
doi: 10.2337/db11-1711. Epub 2012 Jun 27.

Maturation of human embryonic stem cell-derived pancreatic progenitors into functional islets capable of treating pre-existing diabetes in mice

Affiliations

Maturation of human embryonic stem cell-derived pancreatic progenitors into functional islets capable of treating pre-existing diabetes in mice

Alireza Rezania et al. Diabetes. 2012 Aug.

Abstract

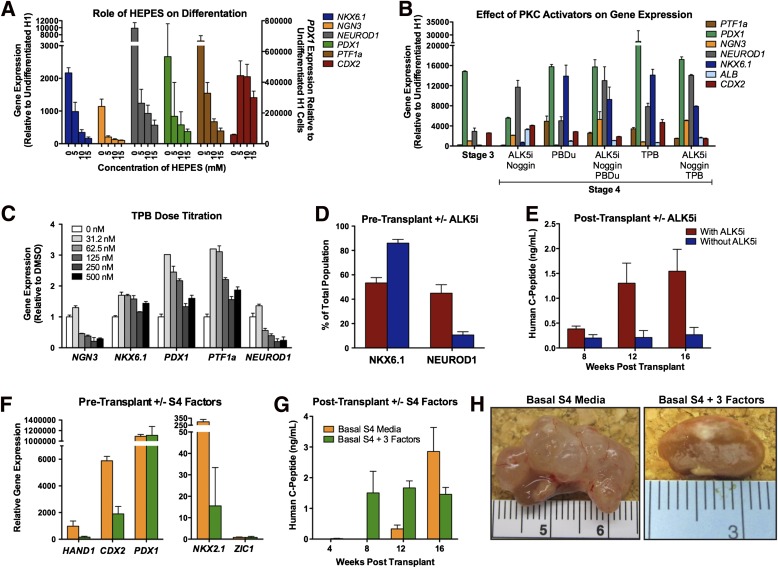
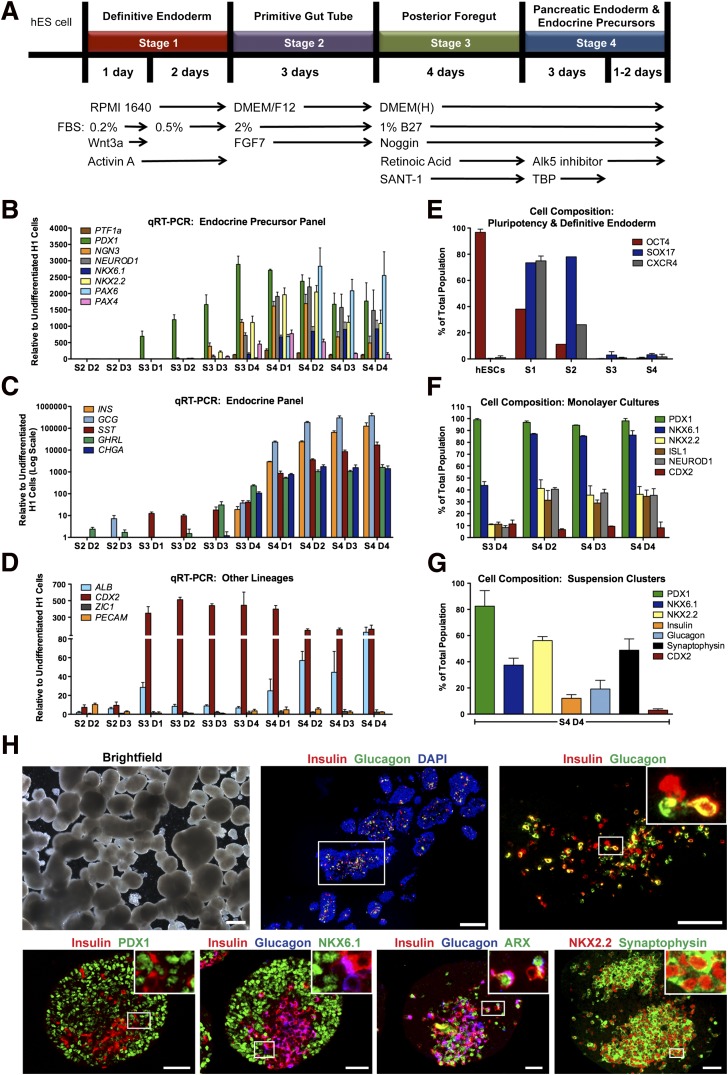
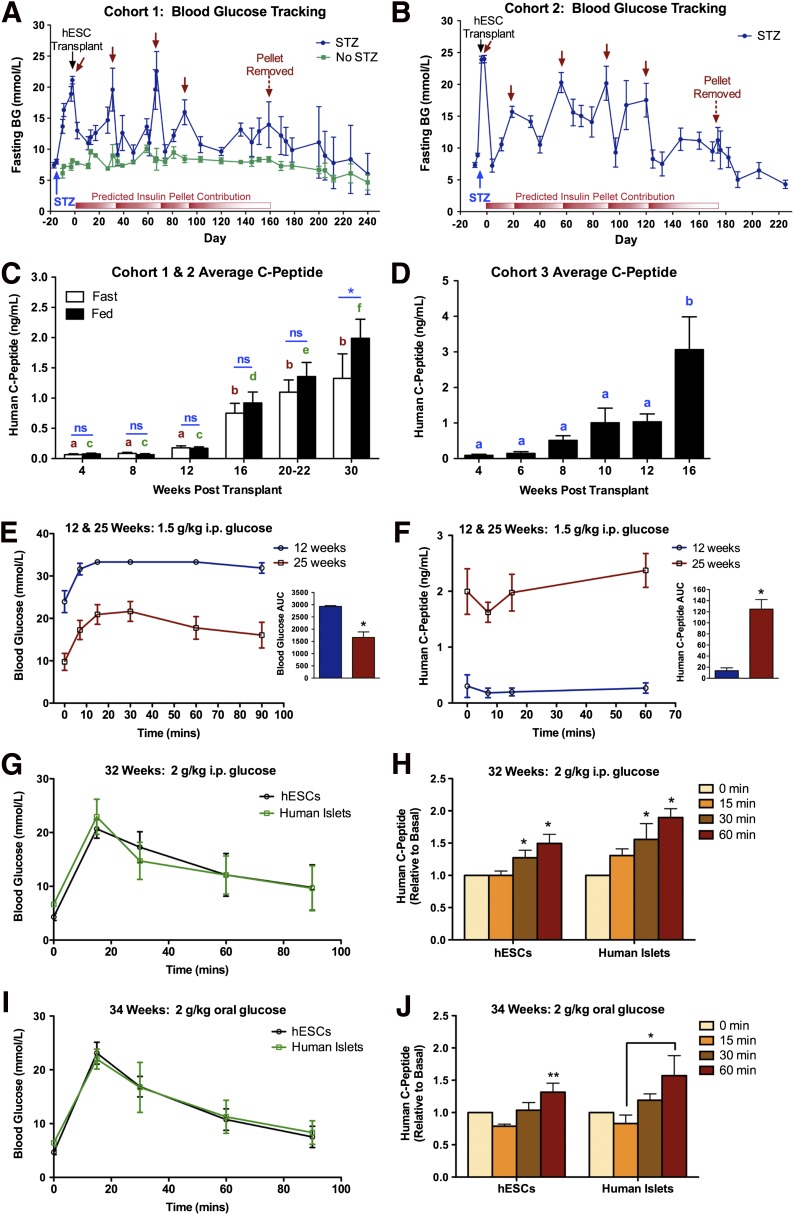
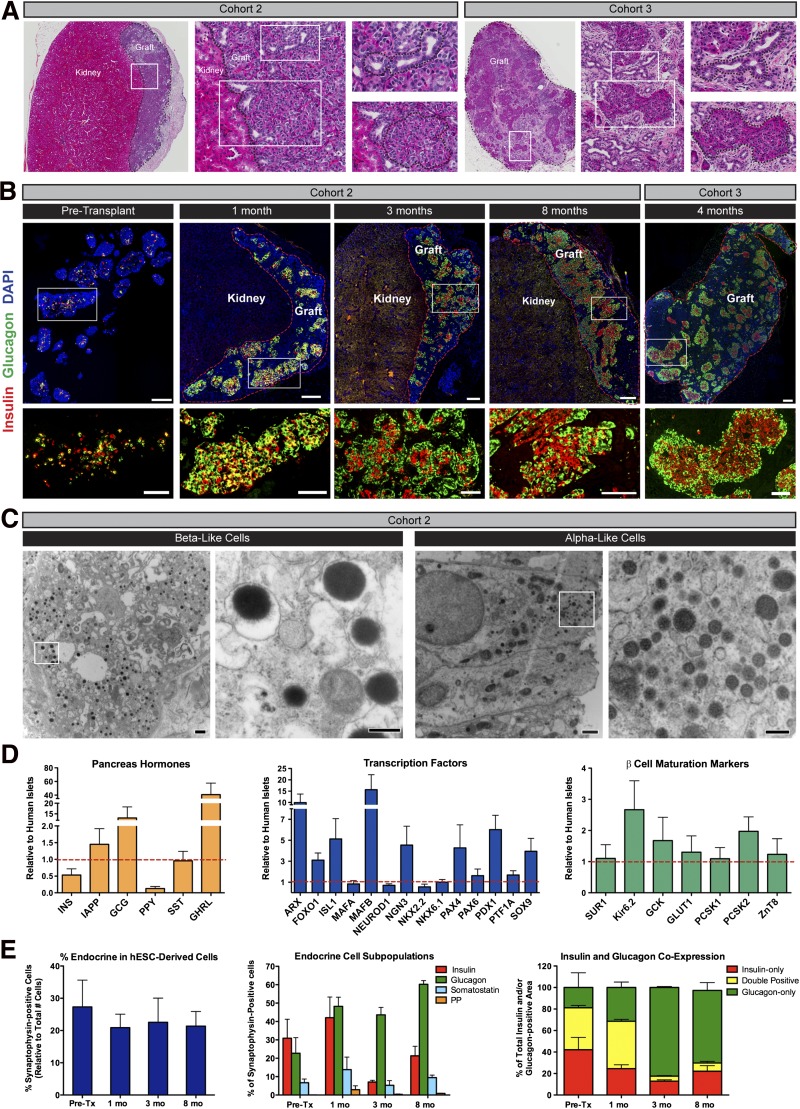
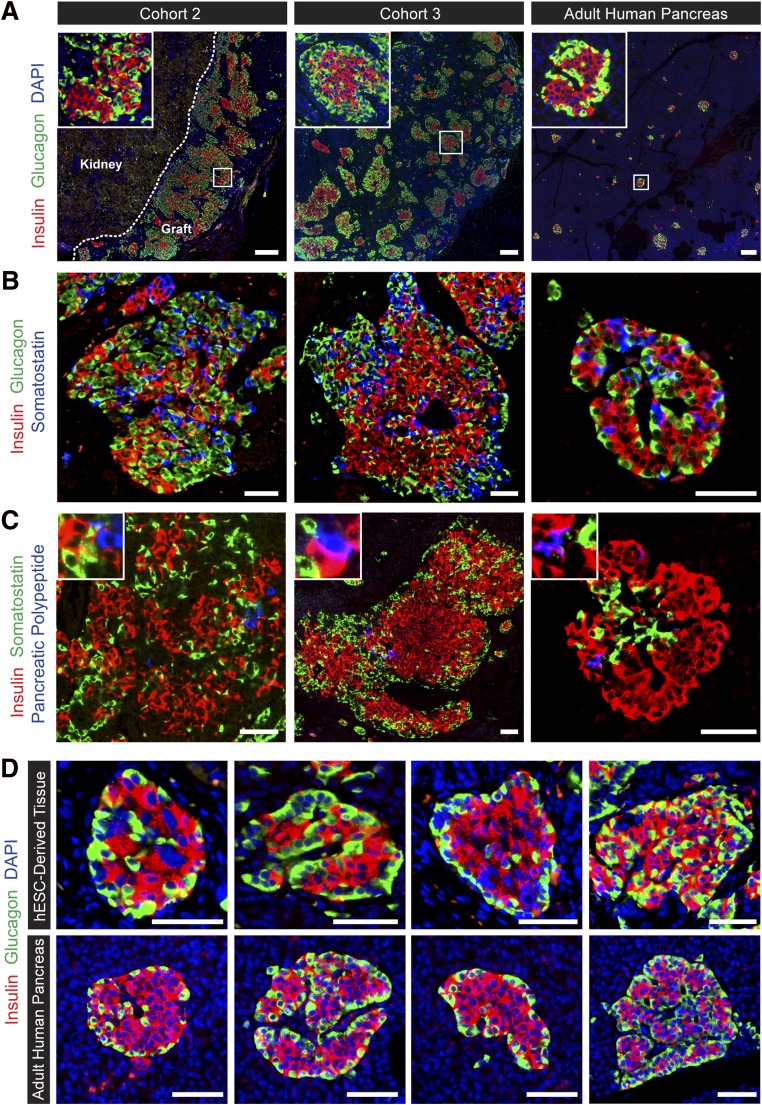
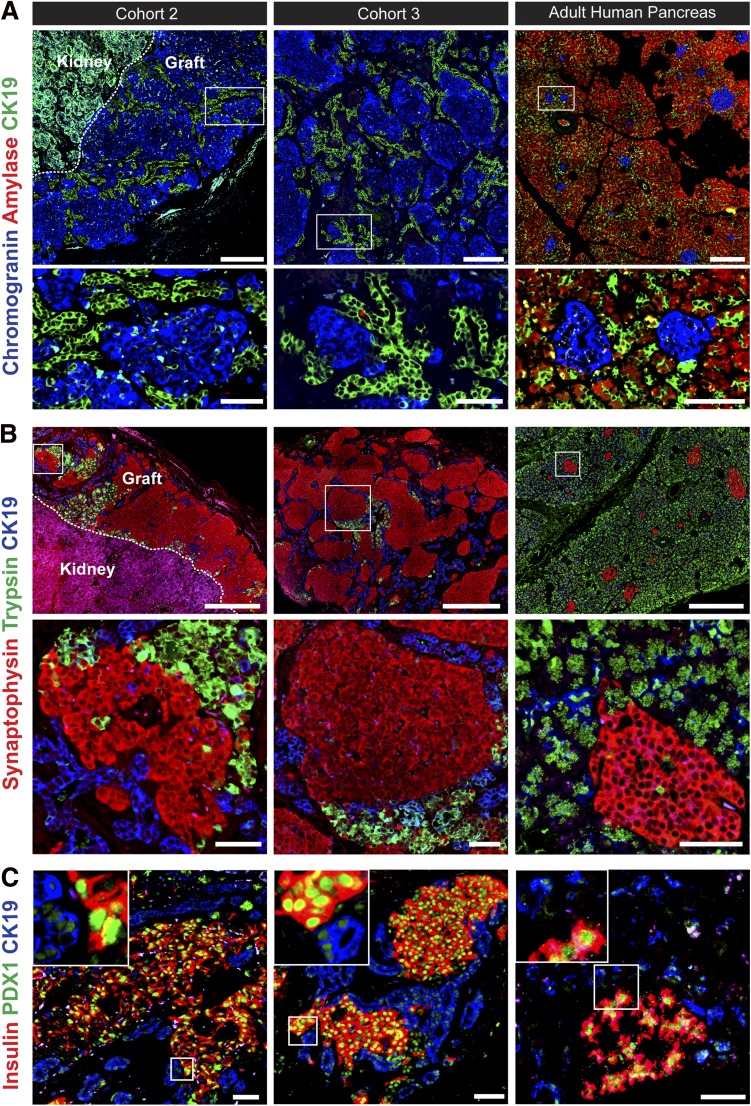
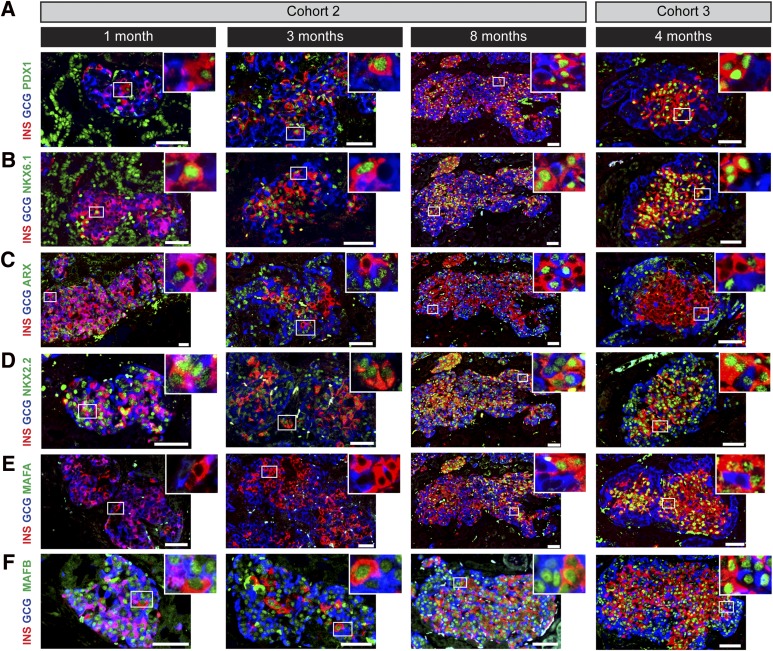
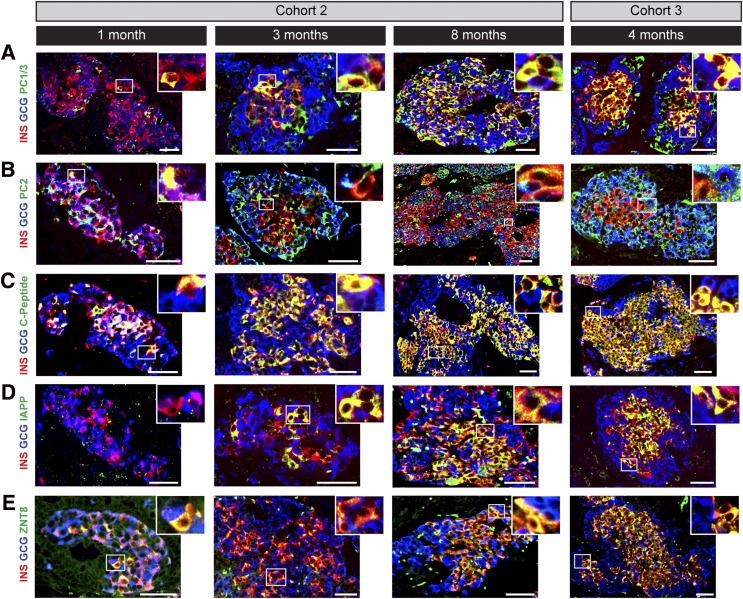
Diabetes is a chronic debilitating disease that results from insufficient production of insulin from pancreatic β-cells. Islet cell replacement can effectively treat diabetes but is currently severely limited by the reliance upon cadaveric donor tissue. We have developed a protocol to efficiently differentiate commercially available human embryonic stem cells (hESCs) in vitro into a highly enriched PDX1+ pancreatic progenitor cell population that further develops in vivo to mature pancreatic endocrine cells. Immature pancreatic precursor cells were transplanted into immunodeficient mice with streptozotocin-induced diabetes, and glycemia was initially controlled with exogenous insulin. As graft-derived insulin levels increased over time, diabetic mice were weaned from exogenous insulin and human C-peptide secretion was eventually regulated by meal and glucose challenges. Similar differentiation of pancreatic precursor cells was observed after transplant in immunodeficient rats. Throughout the in vivo maturation period hESC-derived endocrine cells exhibited gene and protein expression profiles that were remarkably similar to the developing human fetal pancreas. Our findings support the feasibility of using differentiated hESCs as an alternative to cadaveric islets for treating patients with diabetes.


Figures

FIG. 1.
FIG. 1.
Optimization of the in vitro differentiation protocol. AC: The effect of various stage 4 (S4) formulations on gene expression of pancreatic endocrine (PDX1, PTF1a, NEUROD1, NKX6.1, and NGN3), intestinal (CDX2), and hepatic (ALB) lineage markers. Specifically, the following conditions were examined: addition of HEPES to DMEM-HG S4 medium (A); various combinations of ALK5i, Noggin, and/or protein kinase C (PKC) activators, PBDu or TPB, during S4 (B); and different TPB concentrations during S4 (C). D: Removal of ALK5i during S4 resulted in more NKX6.1-positive cells, but fewer NeuroD1-positive cells, as determined by fluorescence-activated cell sorter (FACS) quantification. E: Human C-peptide levels (ng/mL) at 8, 12, and 16 weeks following transplantation of cells differentiated with and without ALK5i during S4 (i.e., ALK5i/TPB/Noggin vs. TPB/Noggin). FH: When compared with basal media only (no factors), addition of all 3 factors (ALK5i/TBP/Noggin) during S4 significantly reduced expression of nonpancreatic lineage markers in S4, including mesenchyme (HAND1), intestine (CDX2), and lung (NKX2.1) in culture (F) and reduced the overgrowth of cells following transplantation (H). G: Human C-peptide levels (ng/mL) at 4, 8, 12, and 16 weeks following transplantation of hESCs differentiated with or without the 3 factors in S4 media. Data in panels AC are presented as mean ± SD, and data in panels DG are presented as mean ± SEM. (A high-quality digital representation of this figure is available in the online issue.)
FIG. 2.
FIG. 2.
Characterization of hESC-derived pancreatic progenitor cells before transplantation. A: Schematic of the 14-day, 4-stage differentiation protocol. Gene expression was assessed throughout stages 2–4 (S2–S4) and expressed relative to undifferentiated H1 cells for levels of endocrine precursor markers (linear scale) (B), pancreatic hormones (log scale) (C), and other lineages, including hepatic (ALB), intestinal (CDX2), neural crest (ZIC1), and hematopoietic (PECAM) (D). E: Fluorescence-activated cell sorter (FACS) quantification of the proportion of cells expressing OCT4, SOX17, or CXCR4 during each stage of in vitro development. F: Quantification of various pancreatic and intestinal lineage markers in monolayer cultures by high content imaging from stage 3 day (D) 4 to S4 D4. G: FACS quantification of the proportion of cells expressing various transcription factors, insulin, glucagon, and synaptophysin in S4 suspension cell clusters before transplantation. H: Representative images of cell clusters before transplant, including brightfield (scale bar = 500 μm) and immunofluorescent staining for insulin, glucagon, synaptophysin, and various transcription factors (scale bars = 50 μm). All data are presented as mean ± SD. qRT-PCR, quantitative RT-PCR; hES, human embryonic stem. (A high-quality digital representation of this figure is available in the online issue.)
FIG. 3.
FIG. 3.
In vivo tracking of pancreatic endocrine progenitor cells following transplantation. A and B: Blood glucose (BG) levels (mM) following a 4-h fast in mice with (blue) and without (green) STZ for up to 240 days following transplant. A slow-release insulin pellet was replaced as needed (red arrows). Red bars represent the predicted duration of insulin pellet contribution to glucose homeostasis; white regions indicate periods of time when there was likely no contribution from the implanted insulin pellet. By 21 weeks, mice in two cohorts were normoglycemic without exogenous insulin. C: Average human C-peptide levels (ng/mL) after an overnight fast and a 45-min meal at various time points posttransplant in cohorts 1 and 2. C-peptide levels increased over time (fasted: a vs. b = P < 0.05, fed: c vs. d/e/f, d vs. e/f, and e vs. f = P < 0.05). At 30 weeks, engrafted cells secreted human C-peptide in response to the meal challenge (*P < 0.05, fed vs. fast; ns, not significant). D: Average human C-peptide levels in random fed plasma samples from cohort 3 (a vs. b = P < 0.05). Blood glucose (E) and human C-peptide levels (F) after a 1.5 g/kg i.p. glucose tolerance test (GTT) at 12 and 25 weeks posttransplant are shown. Area under the curve (AUC) values are provided in the inset bar graphs (*P < 0.05, 12 vs. 25 weeks). G and I: STZ-injected mice with engrafted hESCs (black lines) had normal glucose tolerance, comparable with nondiabetic (no STZ; green lines) mice transplanted with human islets, during an intraperitoneal (G) and oral (I) GTT at 32 and 34 weeks posttransplant, respectively. H and J: Human C-peptide was secreted from hESC-derived cells in a similar manner to engrafted human islets during both the intraperitoneal (H; *P < 0.05, vs. 0 min) and oral (J; *P < 0.05, 60 vs. 15 min; **P < 0.05, 60 vs. 0, 15, and 30 min) GTTs. All values are provided as mean ± SEM.
FIG. 4.
FIG. 4.
Graft morphology and composition after transplantation. A: Representative image of Hematoxylin-eosin (H&E)–stained kidney with engrafted hESC-derived cells at 34 weeks posttransplant from cohort 2 and dissected graft tissue at 17 weeks from cohort 3. Enlarged regions show examples of ductal (top) and islet-like (bottom) structures, outlined in dashed black lines. B: Representative images of insulin (red) and glucagon (green) expression in hESC-derived cells from cohort 2 before and at 1, 3, and 8 months after transplantation, and cohort 3 at 4 months. Engrafted tissue is demarcated from the kidney by red dashed lines, and enlarged regions illustrating endocrine expression patterns are shown below (without DAPI). Insulin/glucagon bihormonal cells (yellow) were observed pretransplant and at 1 month posttransplant (see inset images; quantified in panel E). Scale bars in top panel = 200 μm and bottom panel = 50 μm. C: Transmission electron microscopy images of engrafted endocrine cells that resemble pancreatic β-like cells (left) and α-like cells (right), containing insulin- and glucagon-like granules, respectively. Scale bars for low-magnification images = 2 μm and high-magnification images = 500 nm. D: Gene expression of pancreas hormones, islet transcription factors, and β-cell maturation markers in engrafted cells at 8 months posttransplant relative to human islets (red dashed line indicates the level of expression in adult human islets). E: Quantification of the endocrine compartment in immunofluorescent images of pretransplant clusters and engrafted cells at 1, 3, and 8 months posttransplant under the kidney capsule. The proportion of endocrine cells within the hESC-derived tissue (number of synaptophysin-positive cells/total number of hESC-derived cells) was determined, as well as the relative number of endocrine cells expressing each of the four main pancreatic hormones (number of synaptophysin-positive cells that coexpress insulin, glucagon, somatostatin, or pancreatic polypeptide/total number of synaptophysin-positive cells). Insulin and glucagon coexpression was assessed as the insulin-positive, glucagon-positive, or insulin/glucagon copositive area relative to the total insulin and/or glucagon-positive area. Data are presented as mean ± SEM. (A high-quality digital representation of this figure is available in the online issue.)
FIG. 5.
FIG. 5.
Comparison of islet-like endocrine cells in mature hESC-derived and adult human pancreas. AC: Representative immunofluorescent staining of hESC-derived engrafted cells from cohorts 2 (34 weeks) and 3 (17 weeks), as compared with adult human pancreas. A: The distribution of insulin and glucagon expression in engrafted hESC-derived cells versus adult human pancreas. Scale bars = 200 μm. Islet-like endocrine clusters also express other pancreatic hormones, including somatostatin (B) and pancreatic polypeptide (C) (see insets); scale bars = 50 μm. D: Various examples of observed islet-like architecture within hESC-derived engrafted cells at 8 months posttransplant (top row), closely resembling the typical islet morphologies observed in adult human pancreas (bottom row). Scale bars = 50 μm. (A high-quality digital representation of this figure is available in the online issue.)
FIG. 6.
FIG. 6.
Comparison of endocrine, exocrine, and ductal compartments in mature hESC-derived engrafted tissue and adult human pancreas. A: hESC-derived engrafted cells were composed mainly of endocrine (chromogranin A-positive; blue) and ductal (CK19-positive; green) cells and lacked expression of amylase, a marker of mature acinar cells (red); enlarged regions are shown below. Scale bars in top panel = 200 μm and bottom panel = 50 μm. B: Trypsin immunoreactivity (green) was detected in small regions of the mature, engrafted cells; enlarged regions showing the presence of endocrine (synaptophysin-positive; red), ductal (CK19-positive; blue), and immature exocrine (trypsin-positive; green) cells are shown below. Scale bars in top panel = 500 μm and bottom panel = 50 μm. C: PDX1 (green) was weakly expressed in CK19-positive ductal cells (blue) and strongly expressed in neighboring insulin-positive cells (red), similar to adult human pancreas; scale bars = 50 μm. (A high-quality digital representation of this figure is available in the online issue.)
FIG. 7.
FIG. 7.
Transcription factor expression in insulin- and glucagon-positive cells during graft maturation. hESC-derived cells from cohort 2 at 1, 3, and 8 months posttransplant, and cohort 3 at 4 months, immunostained for insulin (INS; red), glucagon (GCG; blue), and various transcription factors (green), including PDX1 (A), NKX6.1 (B), ARX (C), NKX2.2 (D), MAFA (E), and MAFB (F). See insets for an enlarged region illustrating transcription factor localization. All scale bars = 50 μm. (A high-quality digital representation of this figure is available in the online issue.)
FIG. 8.
FIG. 8.
Characteristics of mature β-cells. hESC-derived cells from cohort 2 at 1, 3, and 8 months posttransplant, and cohort 3 at 4 months, immunostained for insulin (INS; red), glucagon (GCG; blue), and various markers of mature β-cells (green), including prohormone convertase 1/3 (PC1/3) (A), PC2 (B), C-peptide (C), islet amyloid polypeptide (IAPP) (D), and zinc transporter 8 (ZNT8) (E). See insets for an enlarged region illustrating marker colocalization with insulin-positive cells. All scale bars = 50 μm. (A high-quality digital representation of this figure is available in the online issue.)

References

    1. Mathis D, Vence L, Benoist C. Beta-cell death during progression to diabetes. Nature 2001;414:792–798 - PubMed
    1. Ryan EA, Lakey JR, Rajotte RV, et al. . Clinical outcomes and insulin secretion after islet transplantation with the Edmonton protocol. Diabetes 2001;50:710–719 - PubMed
    1. Shapiro AM, Lakey JR, Ryan EA, et al. . Islet transplantation in seven patients with type 1 diabetes mellitus using a glucocorticoid-free immunosuppressive regimen. N Engl J Med 2000;343:230–238 - PubMed
    1. Kelly OG, Chan MY, Martinson LA, et al. . Cell-surface markers for the isolation of pancreatic cell types derived from human embryonic stem cells. Nat Biotechnol 2011;29:750–756 - PubMed
    1. Jiang J, Au M, Lu K, et al. . Generation of insulin-producing islet-like clusters from human embryonic stem cells. Stem Cells 2007;25:1940–1953 - PubMed

Publication types