. 2012 Sep;86(17):9443-53.
doi: 10.1128/JVI.00873-12. Epub 2012 Jun 27.

Entry of hepatitis B virus into immortalized human primary hepatocytes by clathrin-dependent endocytosis

Affiliations

Entry of hepatitis B virus into immortalized human primary hepatocytes by clathrin-dependent endocytosis

Hsiu-Chen Huang et al. J Virol. 2012 Sep.

Abstract

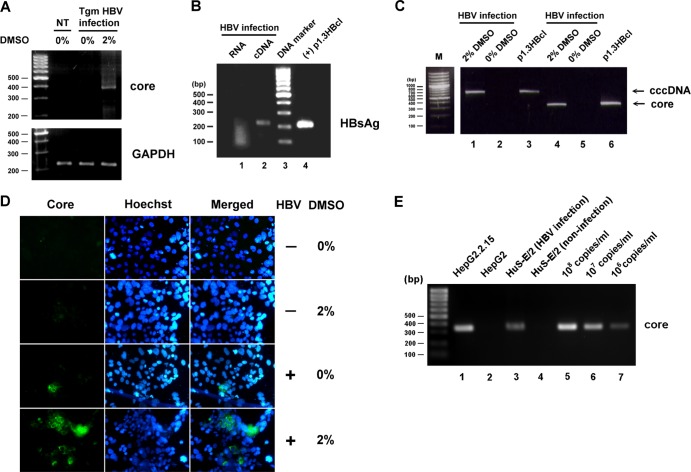
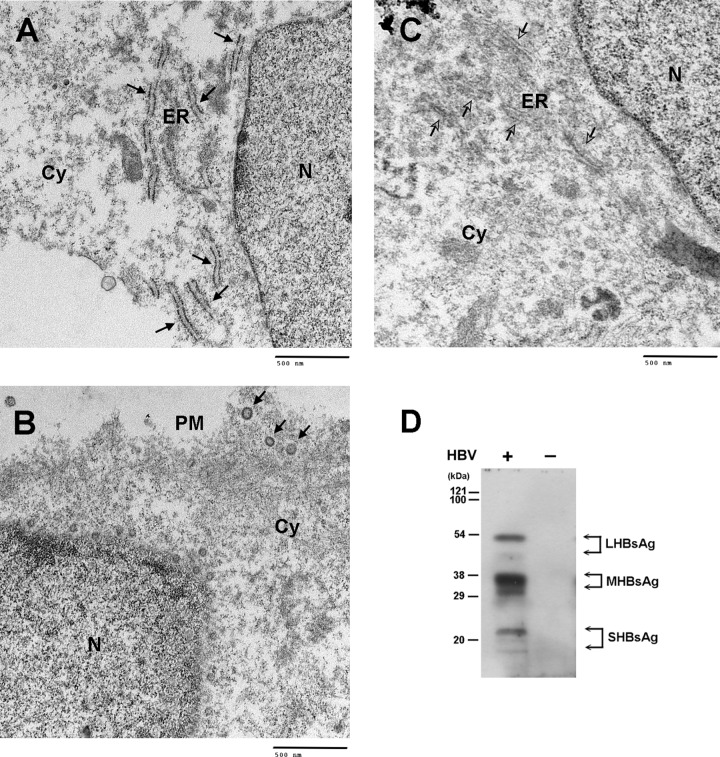
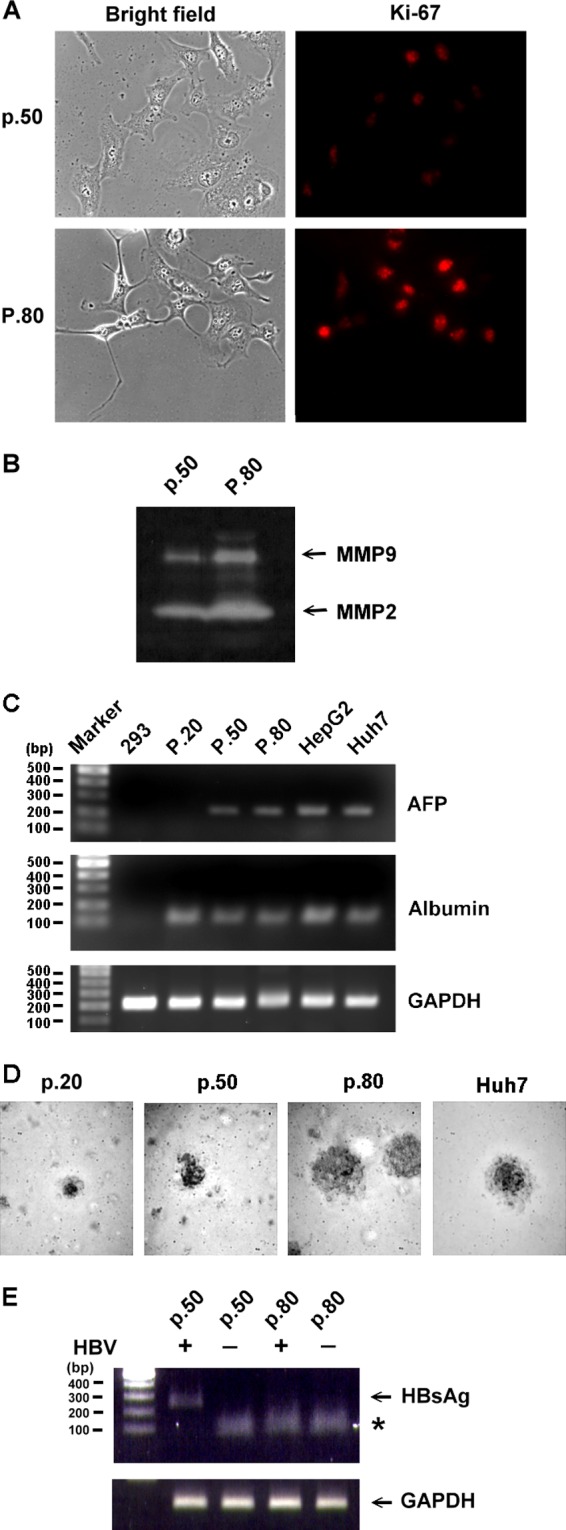
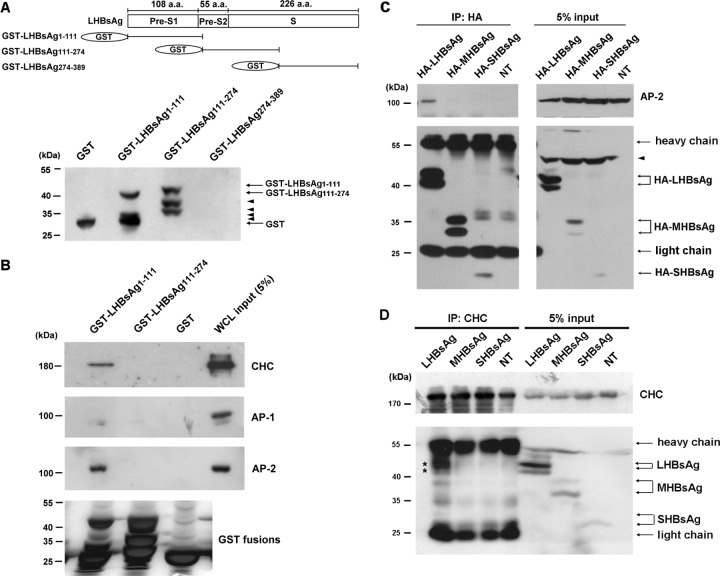
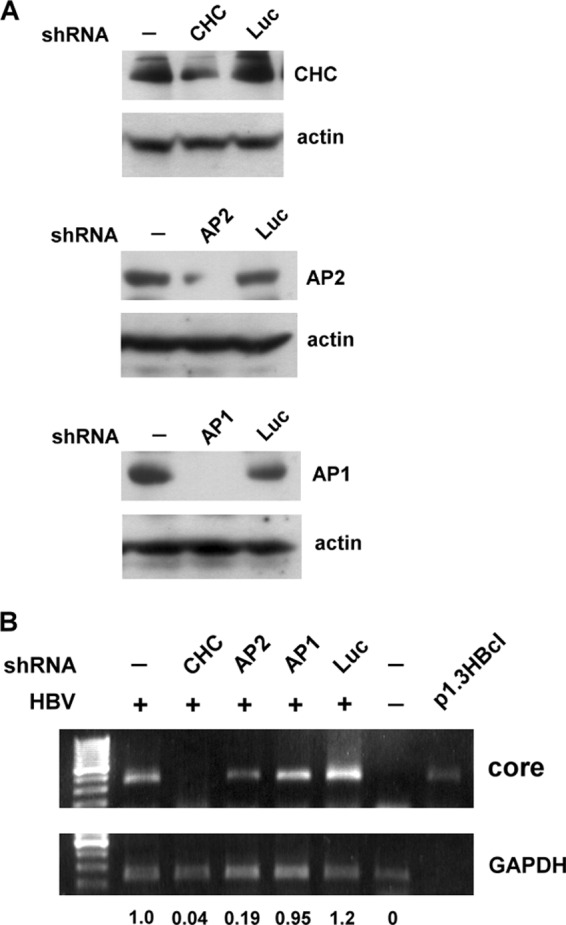
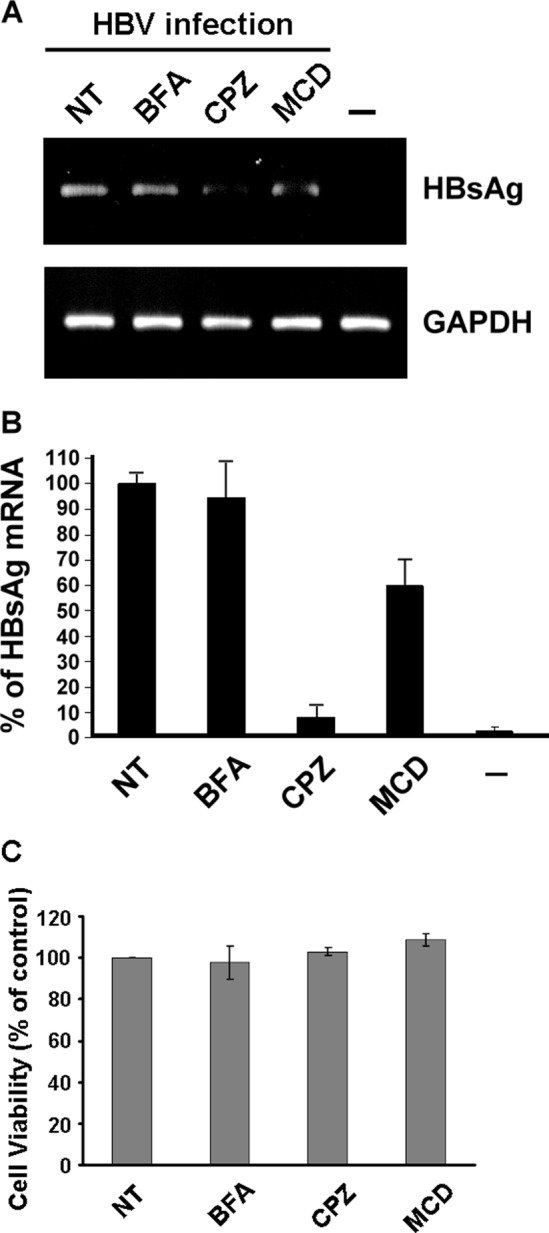
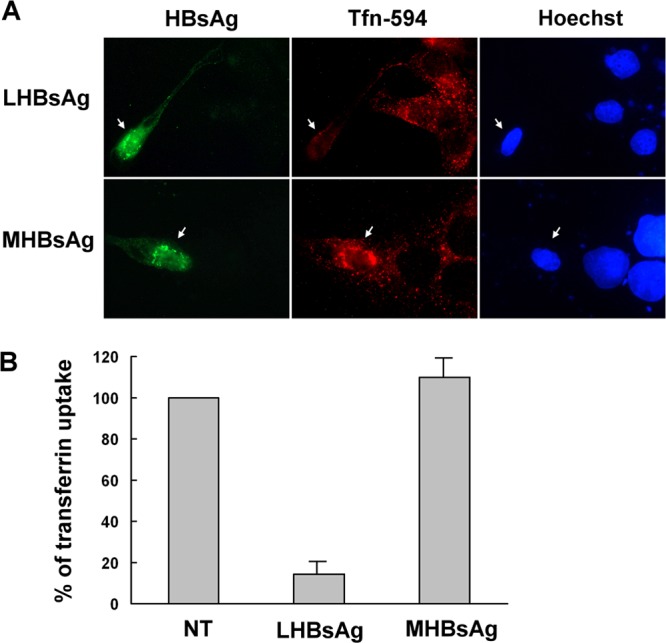
The lack of a suitable in vitro hepatitis B virus (HBV) infectivity model has limited examination of the early stages of the virus-cell interaction. In this study, we used an immortalized cell line derived from human primary hepatocytes, HuS-E/2, to study the mechanism of HBV infection. HBV infection efficiency was markedly increased after dimethyl sulfoxide (DMSO)-induced differentiation of the cells. Transmission electron microscopy demonstrated the presence of intact HBV particles in DMSO-treated HBV-infected HuS-E/2 cells, which could be infected with HBV for up to at least 50 passages. The pre-S1 domain of the large HBsAg (LHBsAg) protein specifically interacted with clathrin heavy chain (CHC) and clathrin adaptor protein AP-2. Short hairpin RNA knockdown of CHC or AP-2 in HuS-E/2 cells significantly reduced their susceptibility to HBV, indicating that both are necessary for HBV infection. Furthermore, HBV entry was inhibited by chlorpromazine, an inhibitor of clathrin-mediated endocytosis. LHBsAg also interfered with the clathrin-mediated endocytosis of transferrin by human hepatocytes. This infection system using an immortalized human primary hepatocyte cell line will facilitate investigations into HBV entry and in devising therapeutic strategies for manipulating HBV-associated liver disorders.


Figures

Fig 1
Fig 1
HBV infection of DMSO-treated HuS-E/2 immortalized primary human hepatocytes. (A) HuS-E/2 cells were cultured for 12 days with 2% DMSO or were left untreated and were then incubated for 20 h with sera from HBV-transgenic mice (Tgm HBV infection); controls were DMSO-untreated cells not incubated with HBV (not treated [NT]). Infection was performed at a multiplicity of infection of about 5 HBV genome equivalents per cell. After removal of nonbound HBV, the cells were incubated for a further 12 days in the presence of 2% DMSO, and then RNA was isolated and amplified to detect the presence of HBV core protein mRNA. Control RT-PCRs were performed for endogenous GAPDH. The DNA markers are shown as molecular masses in 100-bp increments on the left. (B) DMSO-differentiated HuS-E/2 cells were incubated for 20 h with HBV concentrated from the culture medium of HepG2.2.15 cells grown for 12 days. Infection was performed at a multiplicity of infection of 10. RNA was then isolated and subjected to reverse transcription to generate cDNA, and PCR was performed to detect the presence of HBV HBsAg mRNA. Lane 1, PCR results for the RNA sample; lane 2, PCR results for the cDNA sample; lane 3, DNA markers; lane 4, positive control of plasmid p1.3HBcl (+). (C) Total DNA was isolated from HBV-infected DMSO-treated cells (lanes 1 and 4) or DMSO-untreated cells (lanes 2 and 5) and subjected to PCR to detect the presence of HBV cccDNA (lanes 1 and 2) or core protein DNA (lanes 4 and 5). Lanes 3 and 6, positive-control plasmid p1.3HBcl. (D) HuS-E/2 cells seeded on 18-mm coverslips were treated for 12 days with 2% DMSO or were left untreated and were then incubated with HBV for 20 h, washed, and incubated for an additional 12 days with or without 2% DMSO. Viral infection was then examined by indirect immunofluorescence staining using monoclonal anti-core protein antibody (left) and Hoechst 33258 (center), applied at the same time as the secondary antibody to label the nucleus. The stained cells were visualized by fluorescence microscopy. (E) Total DNA was isolated from the 100-fold-concentrated culture medium from HepG2.2.15 cells (lane 1), HepG2 cells (lane 2), HBV-infected DMSO-treated cells (lanes 3), or noninfected DMSO-treated cells (lane 4) and subjected to PCR to detect the HBV genomic DNA. Lanes 5 to 7, serial dilutions of a known amount of plasmid p1.3HBcl as standard.
Fig 2
Fig 2
TEM analysis of HBV-infected DMSO-treated HuS-E/2 cells and collection of secreted HBV particles. (A to C) TEM images of DMSO-treated HuS-E/2 cells producing HBV particles. Twenty hours after infection with HBV, DMSO-treated HuS-E/2 cells were washed and then incubated for 10 days, when immunogold labeling of HBsAg was performed using polyclonal anti-HBsAg antibodies, followed by secondary antibody coupled to 18-nm-diameter gold particles, and images were obtained by TEM. Black arrows, HBsAg at the ER (A) and intact HBV particles at the plasma membrane (B); white arrows, ER region in noninfected cells (C). N, nucleus; ER, endoplasmic reticulum; Cy, cytoplasm; PM, plasma membrane. (D) Western blot analysis of HBV particles secreted from HBV-infected DMSO-treated HuS-E/2 cells. DMSO-treated HuS-E/2 cells were infected with HBV for 20 h, washed with PBS, and incubated for a further 12 days. The culture medium was changed and collected every 4 days, and the samples were pooled and centrifuged to concentrate the virus particles as described in Materials and Methods. Western blot analysis was performed using anti-HBsAg antibodies. Lane −, noninfected cells as a control.
Fig 3
Fig 3
Characterization of HuS-E/2 cells at different passages and their susceptibility to HBV. (A) Immunofluorescence staining for Ki-67. HuS-E/2 cells at passage 50 (p.50) and passage 80 (P.80) were subjected to immunofluorescence staining with rabbit anti-Ki-67 antibodies and Cy3-conjugated goat anti-rabbit IgG antibodies (red) and visualized under a fluorescence microscope (right). Phase-contrast images are shown on the left. (B) Increase in MMP-2 and MMP-9 gelatinolytic activity in HuS-E/2 cells with increased numbers of passages. The zymographic assay was performed after the indicated number of passages. (C) Levels of mRNAs coding for AFP and albumin in 293 cells, HuS-E/2 cells at passages 20, 50, and 80, HepG2 cells, and Huh7 cells. RNA was isolated from cells and analyzed by RT-PCR. Control RT-PCRs were performed for endogenous GAPDH. DNA markers are shown as molecular masses in 100-bp increments. (D) Colony formation in soft agar of HuS-E/2 cells at passage 20, 50, or 80 and of Huh7 cells. Cells were incubated in 0.35% agarose containing 10% FCS on top of 0.7% agarose containing 10% FCS at 37°C for 14 days, and then colonies were photographed under a light microscope. (E) HuS-E/2 cells at passage 50 or 80 were cultured for 12 days with 2% DMSO and incubated with or without HBV for 20 h, and then nonbound HBV was removed and the cells were incubated for an additional 12 days, when RNA was isolated and subjected to reverse transcription and PCR analysis to detect the presence of HBV HBsAg mRNA. Control PCRs were performed for endogenous GAPDH. DNA markers are shown as molecular masses in 100-bp increments.
Fig 4
Fig 4
Interaction between LHBsAg and CHC or AP-2. (A) (Top) Schematic representation of the amino acid (a.a.) residues within the LHBsAg subdomains, designated pre-S1, pre-S2, and S; (bottom) Western blot results when LHBsAg cDNA fragments coding for amino acids 1 to 111, 111 to 274, or 274 to 389 were cloned into pGEX-6p-1 for expression in E. coli and purification as GST fusion proteins and antibodies against GST were used to detect the expression of the GST fusion proteins. Arrowheads, leaky expression of proteins. (B) GST pulldown assay. GST-LHBsAg fusion proteins or GST bound to glutathione-Sepharose 4B beads were incubated with lysates of HuS-E/2 cells, and then, after GST pulldown, Western blot analysis was performed using antibodies against CHC, AP-1, AP-2, or GST. The positions of molecular mass markers are shown on the left. (C and D) Coimmunoprecipitation and Western blot analysis. HuS-E/2 cells were transfected with plasmid pcDNA3.0-HA-LHBsAg, pcDNA3.0-HA-MHBsAg, or pcDNA3.0-HA-SHBsAg coding, respectively, for HA-tagged LHBsAg, MHBsAg, or SHBsAg, and then, at 2 days posttransfection, the cells were harvested and subjected to immunoprecipitation (IP) with antibodies specific for HA (C) or CHC (D), followed by Western blot analysis with antibodies against HA, AP-2, or CHC, as indicated. NT, nontransfected cells. The molecular mass markers are indicated on the left. Asterisks, proteins coimmunoprecipitated with CHC; arrowheads, nonspecific bands.
Fig 5
Fig 5
shRNA-mediated knockdown of CHC or AP-2 inhibits HBV infection. (A) shRNA knockdown of CHC, AP-2, or AP-1. DMSO-treated HuS-E/2 cells were transfected with plasmids expressing shRNAs specific for CHC (top), AP-2 (center), or AP-1 (bottom); cells transfected with plasmid containing shRNA against luciferase (Luc) served as controls. At 2 days posttransfection, Western blot analysis was performed using antibodies against CHC, AP-2, or AP-1, as indicated, with actin as the internal control. (B) Effect of CHC, AP-2, or AP-1 knockdown on HBV infection. DMSO-treated HuS-E/2 cells were transfected with shRNAs against CHC, AP-2, or AP-1 as described for panel A, and then at 2 days posttransfection were subjected to HBV infection or left untreated. At 12 days postinfection, RNA was isolated from the infected cells and subjected to reverse transcription and PCR analysis to detect HBV core protein mRNA. Plasmid p1.3HBcl served as the positive control. Relative expression levels of core mRNA are shown.
Fig 6
Fig 6
Effect of BFA, CPZ, or MCD on HBV infection. (A) DMSO-treated HuS-E/2 cells were treated with 1 μM BFA, 10 μg/ml of CPZ, or 10 mM MCD for 1 h at 37°C prior to and during HBV infection for 20 h, and then the cells were washed and incubated for 12 days, when RNA was isolated and subjected to reverse transcription and PCR to detect the presence of HBV HBsAg mRNA. Control PCRs were performed for endogenous GAPDH. NT, cells without drug treatment; −, noninfected control. (B) Real-time PCR analysis of HBV gene replication in DMSO-treated HuS-E/2 hepatocytes after inhibitor treatment. The data shown are the means and standard deviations for three independent experiments. (C) Lack of effect of BFA, CPZ, or MCD on the viability of DMSO-treated HuS-E/2 cells. Cells were seeded for 24 h and then treated with 1 μM BFA, 10 μg/ml of CPZ, or 10 mM MCD for 21 h at 37°C. The cells were then washed and incubated for an additional 12 days, when cell viability was measured by the MTT assay. The number of viable cells after treatment is expressed as a percentage of that in the nontreated control (NT). The data are the mean ± standard deviation for three independent experiments.
Fig 7
Fig 7
Effect of LHBsAg on internalization of transferrin. (A) Uptake of Alexa 594-conjugated transferrin in the presence of HBsAgs. Two days after transfection with plasmids encoding LHBsAg and MHBsAg, untreated HuS-E/2 cells were incubated with Alexa 594-conjugated transferrin (red) for 20 min and were then fixed, immunostained with mouse monoclonal anti-HBsAg antibodies and Alexa 488-conjugated goat anti-mouse IgG antibodies (green), and visualized by fluorescence microscopy. Hoechst 33258 (right) was applied at the same time as the secondary antibody to stain nuclei. Arrows, transfected cells. (B) Quantification of transferrin uptake. The intensity of the Alexa 594-conjugated transferrin signal was quantified for 10 transfected cells in each set, and the mean intensity was calculated and normalized against that of the nontransfected cells (NT). The graph shows the means and standard deviations for three independent experiments.

References

    1. Aly HH, et al. 2007. Serum-derived hepatitis C virus infectivity in interferon regulatory factor-7-suppressed human primary hepatocytes. J. Hepatol. 46:26–36 - PubMed
    1. Beasley RP. 1988. Hepatitis B virus. The major etiology of hepatocellular carcinoma. Cancer 61:1942–1956 - PubMed
    1. Bremer CM, Bung C, Kott N, Hardt M, Glebe D. 2009. Hepatitis B virus infection is dependent on cholesterol in the viral envelope. Cell. Microbiol. 11:249–260 - PubMed
    1. Chai N, et al. 2007. Assembly of hepatitis B virus envelope proteins onto a lentivirus pseudotype that infects primary human hepatocytes. J. Virol. 81:10897–10904 - PMC - PubMed
    1. Chen CC, et al. 2007. Long-term inhibition of hepatitis B virus in transgenic mice by double-stranded adeno-associated virus 8-delivered short hairpin RNA. Gene Ther. 14:11–19 - PubMed

Publication types