Effects of potyvirus effective population size in inoculated leaves on viral accumulation and the onset of symptoms
- PMID: 22740417
- PMCID: PMC3446627
- DOI: 10.1128/JVI.00909-12
Effects of potyvirus effective population size in inoculated leaves on viral accumulation and the onset of symptoms
Abstract
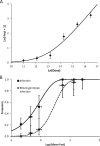
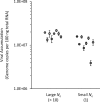
Effective population size (N(e)) is a key parameter for understanding evolutionary processes, but it is generally not considered in epidemiological studies or in studying infections of individual hosts. Whether N(e) has an effect on the onset of symptoms and viral accumulation in Tobacco etch virus (TEV) infection of Nicotiana tabacum plants is considered here. Using mixtures of TEV variants carrying fluorescent markers, the dose dependence of N(e) was confirmed, and the inoculation procedure was found to be the main source of variation in these experiments. Whereas the onset of symptoms was independent of N(e), there was less and more variable accumulation at 6 days postinoculation for small N(e) values (N(e) < 5). The observed variation in accumulation was not heritable, however, suggesting that this variation was not due to the fixation of deleterious mutations in the small founder populations. On the other hand, virus-induced fluorescence and accumulation in the inoculated leaf were strongly N(e) dependent. Systemic accumulation was independent of N(e), although removal of the inoculated leaf led to a small reduction in systemic accumulation for small N(e) values. For whole plants, N(e)-dependent effects on accumulation were no longer observed at 9 days postinoculation. Therefore, the effects of N(e) on accumulation are due mainly to limited expansion in the inoculated leaf and are transient. In this system, N(e)-dependent effects will be strongest at low doses and early in infection. We conclude that N(e) can have implications for epidemiology and infection at the individual host level, beyond determining the rate of mixed-genotype infection.
Figures


Similar articles
-
One is enough: in vivo effective population size is dose-dependent for a plant RNA virus.PLoS Pathog. 2011 Jul;7(7):e1002122. doi: 10.1371/journal.ppat.1002122. Epub 2011 Jul 7. PLoS Pathog. 2011. PMID: 21750676 Free PMC article.
-
Salicylic acid-mediated and RNA-silencing defense mechanisms cooperate in the restriction of systemic spread of plum pox virus in tobacco.Plant J. 2006 Oct;48(2):217-27. doi: 10.1111/j.1365-313X.2006.02861.x. Plant J. 2006. PMID: 17018032
-
Dynamics of the establishment of systemic Potyvirus infection: independent yet cumulative action of primary infection sites.J Virol. 2012 Dec;86(23):12912-22. doi: 10.1128/JVI.02207-12. Epub 2012 Sep 19. J Virol. 2012. PMID: 22993154 Free PMC article.
-
Differential disease symptoms and full-length genome sequence analysis for three strains of Tobacco etch virus.Virus Genes. 2015 Jun;50(3):442-9. doi: 10.1007/s11262-014-1146-9. Epub 2014 Nov 26. Virus Genes. 2015. PMID: 25425495
-
The pleiotropic cost of host-specialization in Tobacco etch potyvirus.Infect Genet Evol. 2008 Dec;8(6):806-14. doi: 10.1016/j.meegid.2008.07.010. Epub 2008 Aug 14. Infect Genet Evol. 2008. PMID: 18765302
Cited by
-
Time-Sampled Population Sequencing Reveals the Interplay of Selection and Genetic Drift in Experimental Evolution of Potato Virus Y.J Virol. 2017 Jul 27;91(16):e00690-17. doi: 10.1128/JVI.00690-17. Print 2017 Aug 15. J Virol. 2017. PMID: 28592544 Free PMC article.
-
Impact of genetic drift, selection and accumulation level on virus adaptation to its host plants.Mol Plant Pathol. 2018 Dec;19(12):2575-2589. doi: 10.1111/mpp.12730. Epub 2018 Oct 25. Mol Plant Pathol. 2018. PMID: 30074299 Free PMC article.
-
The Plant Cellular Systems for Plant Virus Movement.Plant Pathol J. 2017 Jun;33(3):213-228. doi: 10.5423/PPJ.RW.09.2016.0198. Epub 2017 Jun 1. Plant Pathol J. 2017. PMID: 28592941 Free PMC article. Review.
-
Improving the effectiveness of artificial microRNA (amiR)-mediated resistance against Turnip mosaic virus by combining two amiRs or by targeting highly conserved viral genomic regions.J Virol. 2013 Jul;87(14):8254-6. doi: 10.1128/JVI.00914-13. Epub 2013 May 22. J Virol. 2013. PMID: 23698292 Free PMC article.
-
Engineering Resistance Against Viruses in Field Crops Using CRISPR- Cas9.Curr Genomics. 2021 Oct 18;22(3):214-231. doi: 10.2174/1389202922666210412102214. Curr Genomics. 2021. PMID: 34975291 Free PMC article. Review.
References
-
- Bald JG. 1937. The use of numbers of infections for comparing the concentration of plant virus suspensions: dilution experiments with purified suspensions. Ann. Appl. Biol. 24:33–55
-
- Bedhomme S, Lafforgue G, Elena SF. 2012. Multihost experimental evolution of a plant RNA virus reveals local adaptation and host-specific mutations. Mol. Biol. Evol. 29:1481–1492 - PubMed

