. 2012 Aug;18(8):1510-26.
doi: 10.1261/rna.033308.112. Epub 2012 Jun 27.

Disease-linked microRNA-21 exhibits drastically reduced mRNA binding and silencing activity in healthy mouse liver

Affiliations

Disease-linked microRNA-21 exhibits drastically reduced mRNA binding and silencing activity in healthy mouse liver

John R Androsavich et al. RNA. 2012 Aug.

Abstract

MicroRNAs (miRNAs) bind to mRNAs and fine-tune protein output by affecting mRNA stability and/or translation. miR-21 is a ubiquitous, highly abundant, and stress-responsive miRNA linked to several diseases, including cancer, fibrosis, and inflammation. Although the RNA silencing activity of miR-21 in diseased cells has been well documented, the roles of miR-21 under healthy cellular conditions are not well understood. Here, we show that pharmacological inhibition or genetic deletion of miR-21 in healthy mouse liver has little impact on regulation of canonical seed-matched mRNAs and only a limited number of genes enriched in stress response pathways. These surprisingly weak and selective regulatory effects on known and predicted target mRNAs contrast with those of other abundant liver miRNAs such as miR-122 and let-7. Moreover, miR-21 shows greatly reduced binding to polysome-associated target mRNAs compared to miR-122 and let-7. Bioinformatic analysis suggests that reduced thermodynamic stability of seed pairing and target binding may contribute to this deficiency of miR-21. Significantly, these trends are reversed in human cervical carcinoma (HeLa) cells, where miRNAs including miR-21 show enhanced target binding within polysomes and where miR-21 triggers strong degradative activity toward target mRNAs. Taken together, our results suggest that, under normal cellular conditions in liver, miR-21 activity is maintained below a threshold required for binding and silencing most of its targets. Consequently, enhanced association with polysome-associated mRNA is likely to explain in part the gain of miR-21 function often found in diseased or stressed cells.


Figures

FIGURE 1.
FIGURE 1.
Array profiling of liver mRNA following miRNA inhibition or knockout. (A) Total gene expression changes in response to anti-miR treatment. Left, fraction of total genes measured which were significantly (P < 0.05, Student's t-test) up-regulated (positive y-axis) or down-regulated (negative y-axis). Right, the magnitudes of change in expression for the same fractions plotted as cumulative distribution frequencies. The dotted line represents the median. (B) Schematic of canonical miRNA seed:mRNA seed-matched pairing for miR-122, let-7, and miR-21. The miRNA seed region, nucleotides 2–8 in the 5′ end of a miRNA, binds to 7- or 8-nt seed-matched sequences in the 3′ UTRs of mRNA transcripts. Three variations of seed matches have been identified as being the most critical for miRNA binding: heptanucleotide sequences complementary to either position 2–8 of the miRNA (7m8) or position 2–7 with an adenosine at position 1 (7m1A), or octanucleotide sequences complementary to position 2–8 plus an adenosine at position 1 (8m). Note that while Watson-Crick base-pairing is not required across from position 1, it frequently occurs since a majority of miRNAs contain uracils at this position. (C) Cumulative distribution frequencies for all profiled genes plotted as a function of fold-change in expression following anti-miR treatment against miR-122 (top), let-7 (middle), or miR-21 (bottom). Genes were binned based on the presence (colored lines) or absence (gray line) of seed-matched sequences complementary to the inhibited miRNA. (D) Heptanucleotide Sylamer analysis of the same data sets shown in C for each indicated treatment. The seed matches for each miRNA are highlighted. All other possible 7-nt sequences not related to the seed match are shown as gray lines and thus represent statistical background noise. The 8m seed match from the octanucleotide analysis is shown superimposed. Heptanucleotide and octanucleotide analyses had similar backgrounds. The peaking of enrichment, calculated as a hypergeometric P-value, for seed-matched sequences on the left-hand side of the plot for miR-122 (top, left) and let-7 (top, right) indicates that the genes most up-regulated upon miRNA inhibition are enriched for the corresponding seed-matched sequence. Enrichment for miR-21 seed-matched genes is not observed when miR-21 is inhibited (bottom, left) or knocked out (bottom, right).
FIGURE 2.
FIGURE 2.
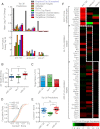
miR-21 inhibition does not derepress expected targets. (A) Comparison between bioinformatic target predictions and observed mRNA changes. Top, mean log2 fold-change of the top 30 ranked targets from each computational prediction algorithm shown for the corresponding miRNA of each treatment. Gray bars show the mean fold-change of the observed top 30 most up-regulated seed-matched mRNAs and thus represent the highest fold-change possible for any of the predictions. Dashed red lines show the mean fold-change for all seed-matched mRNAs for each miRNA. Bottom, the number of the top 30 predicted targets from each algorithm that were significantly up-regulated (≥10% increase in mRNA with P ≤ 0.05, Student's t-test). (B) Box-and-whisker plots of calculated free energies of target binding for each miR-122 (blue), let-7 (green), and miR-21 (red). Each bar represents five values: the median (center line), 25th percentile (bottom of box), 75th percentile (top of box), maximum free energy (bottom line), and minimum free energy (top line). (***) P < 0.001, determined by Kruskal-Wallis test with Dunn's post-test. (C) Predicted number of 3′ UTR target sites for each miRNA binned by seed-match type. (D) Cumulative distribution frequencies for TargetScan Context+ scores for the indicated miR-122 (blue), let-7 (green), miR-21 (red), and miR-23a (yellow). Negative scores are ranked higher. (E) Scatter plots of TargetScan Context+ scores for the top 30 predicted targets of the each miRNA. Each center line represents the median, whereas top and bottom lines denote the interquartile range. (ns) not significant, (***) P < 0.001, determined by Kruskal-Wallis test with Dunn's post-test. (F) Heat map of observed changes in mRNA levels for previously validated targets of miR-122, miR-21, or let-7 curated in miRecords database. Expression changes for each gene are shown for all three anti-miR treatments, with the white dashed line highlighting the treatment that corresponds to the miRNA of the prevalidated target. A star marks each gene that was significantly up-regulated upon inhibition of the expected targeting miRNA.
FIGURE 3.
FIGURE 3.
miR-21 inhibition induces expression of stress response genes. (A) mRNA changes for significantly up-regulated stress-response genes following anti-miR-21 treatment. Fold-change levels are plotted relative to those observed for the other anti-miR treatments [fold-changeanti-21 − mean fold-change(anti-122, anti-let-7)] to demonstrate the anti-miR-sequence dependence of induction. Red bars indicate that the gene transcript contains a seed match for miR-21. (B) mRNA changes for stress response activators (HSFs) or related transcriptional genes (TAFs and TBP). Fold-change levels represent those observed for anti-miR-21 treatment alone. A star marks each gene that was significantly up-regulated upon miR-21 inhibition. Red bars indicate that the gene contains a seed match for miR-21.
FIGURE 4.
FIGURE 4.
miR-21 is disproportionally lacking in polysomal complexes. (A) Top, A260 profile and denaturing agarose analysis of sucrose gradient fractions. Arrow indicates the 80S fraction, and the gray box indicates the fractions containing polysomes (PS). Bottom, Western blots of pooled adjacent fractions confirming the presence of RISC proteins throughout the gradient. Inputs for lanes 310 were concentrated 10-fold by precipitation prior to loading, while lanes 12 were not further concentrated. (B) Equal volumes of purified total RNA from each fraction were analyzed with RT-qPCR for the presence of miR-21 (white square), miR-122 (gray triangle), and let-7d (black circle). The fraction copy number for each miRNA is plotted as the percent total copy number detected from all fractions. Each data point shown is the mean from a total N = 7 from three independent experiments. (C) The mean summed percent total from B in fractions 11–20 (highlighted with gray box) for miR-21 (white bar), miR-122 (gray bar), and let-7d (black bar). (***) P < 0.001, calculated by one-way analysis of variance (ANOVA) with Bonferroni post-test. (D) Relative miRNA levels before (unfractionated; white bar) or summed after (fractionated; black bar) sucrose gradient fractionation. Error bars represent standard error of the mean (SEM). (E) miRNA sedimentation is sensitive to translational drop-off. Lysates were treated with puromycin or EDTA to disrupt translation. A260 profiles for puromycin-treated (dashed line) and untreated (solid line) samples. (F) miRNA distributions resulting from puromycin treatment. Inset, comparison of miR-21 (white bars) and miR-122 (black bars) summed percent totals in the densest fractions (normally taken to be polysome-containing fractions) for untreated, puromycin-, and EDTA-treated samples.
FIGURE 5.
FIGURE 5.
The subcellular distribution of miR-21 resembles that of inhibited miRNA. (A) Percent distribution profile of miR-122 in sucrose gradients following a single dose of saline (black circle or bar), anti-122 (white square or bar), or anti-21 (gray triangle or bar) 24 h prior to harvest. Arrow indicates the 80S fraction, and the gray box indicates the fractions containing polysomes (PS). Inset, the corresponding mean summed percent total in polysomal fractions for each treatment. (B) As in A for miR-21. (C) Comparison of miRNA levels in anti-miR treated lysates prior to gradient fractionation. The relative miR-122 (black bars) and miR-21 (white bars) levels were calculated with the 2−ΔΔCt method (Schmittgen and Livak 2008) using miR-22 as a reference. The normalized fold-change levels of miRNA were further set to 1.0 in saline-treated animals. (D) miRNA binding assay with 2′-O-methyl complementary capture RNA. Biotinylated 2′-O-methyl oligos complementary to either miR-21 (black circle and dashed line) or miR-122 (gray square and solid line) were titrated into S16 liver extracts. Bound miRNA was depleted from the extract by precipitation of the capture RNA using streptavidin-coated beads, while unbound miRNA was detected by Northern blot (shown here from a representative experiment). Data were fit with a sigmoidal dose-response curve with variable slope (for miR-21: K1/2 = 0.817 +/− 0.092 nM, hill-slope = 1.080 +/− 0.2194, R2 = 0.962; for miR-122: K1/2 = 1.389 +/− 0.104 nM, hill-slope = 1.130 +/− 0.312, R2 = 0.967). Data points were averaged from duplicate experiments, and error bars represent SEM.
FIGURE 6.
FIGURE 6.
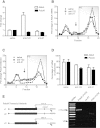
Predicted mRNA targets remain associated with polysomes in the presence and absence of miRNA-mediated repression. (A) Relative levels of AldoA (white bar) and Pdcd4 (black bar), following treatment with anti-miR. mRNA levels were calculated with the 2−ΔΔCt method using GAPDH as a reference. (B) Percent distribution profile for AldoA mRNA, a predicted target for miR-122, in sucrose gradients following a single dose of saline (black circle), anti-122 (white square), or anti-21 (gray triangle) 24 h prior to harvest. Arrow indicates the 80S fraction, and the gray box indicates the fractions containing polysomes (PS). (C) As in B for Pdcd4. (D) The corresponding mean summed percent totals of AldoA (white bars) and Pdcd4 (black bars) mRNA in polysomal fractions for each treatment. Data points were averaged from duplicate experiments, and error bars represent SEM. (E) Three variants of the Pdcd4 transcript are encoded in the same locus in the mouse genome. Left, schematic of variant sequence alignment. The transcripts, which code for the same protein, have variable 5′ UTRs and identical open reading frames (gray box) and 3′ UTRs, except for variant 3, where the miR-21 binding site is absent, but the upstream and downstream portions of the 3′ UTR are retained. Arrows mark the sites for forward (F) and reverse (R) primers for sequence length determination using 3′ rapid amplification of cDNA ends (RACE). Right, agarose gel of PCR products from 3′ RACE. The expected lengths for the variants are marked by arrowheads. Based on intensity comparison between the slower migrating and faster migrating bands, the larger variants containing miR-21 seed matches make up ≥90% of the Pdcd4 transcript population. Reactions containing no reverse transcriptase (no RT) or primers for the actin 3′ UTR served as negative and positive controls, respectively.
FIGURE 7.
FIGURE 7.
miR-21 is highly associated with polysomes and strongly represses a broad range of targets in HeLa cells. (A) Left, percent distribution profile of HeLa miR-21 (dark red circles), HeLa let-7a (dark green triangles), and liver miR-21 (gray open squares) in sucrose gradients loaded with mouse liver or HeLa extracts prepared under the same conditions. The gray box indicates the fractions containing polysomes (PS). Right, the mean summed percent total in polysome fractions 7–13 (highlighted with gray box) for each miRNA (colors are the same as in the left panel). Error bars represent SEM from triplicate experiments. (B) Absolute quantification of miR-21 copy numbers in liver and HeLa lysates normalized to total input RNA. Error bars represent SEM from N = 4 (HeLa) and N = 3 (liver) biological replicates assayed in two independent experiments. (C) Heptanucleotide Sylamer analysis of array profiling of HeLa cells transfected with anti-miR-21 (compared to saline mock transfection). The seed matches for each miRNA are highlighted. All other possible 7-nt sequences not related to the seed match are shown as gray lines and thus represent statistical background noise. The 8m seed match from the octanucleotide analysis is shown superimposed. Heptanucleotide and octanucleotide analyses had similar backgrounds. The peaking of enrichment for miR-21 seed-matched sequences on the left-hand side of the plot indicates that the genes most up-regulated upon miRNA inhibition are enriched for the corresponding seed-matched sequence (cf. mmu liver in Fig. 1D, bottom, left). (D) Heat map comparison of responses in mRNA levels for known targets from inhibition of miR-21 in mouse liver or HeLa.

References

    1. Akerfelt M, Morimoto RI, Sistonen L 2010. Heat shock factors: Integrators of cell stress, development and lifespan. Nat Rev Mol Cell Biol 11: 545–555 - PMC - PubMed
    1. Baek D, Villén J, Shin C, Camargo FD, Gygi SP, Bartel DP 2008. The impact of microRNAs on protein output. Nature 455: 64–71 - PMC - PubMed
    1. Bartel DP 2009. MicroRNAs: Target recognition and regulatory functions. Cell 136: 215–233 - PMC - PubMed
    1. Betel D, Koppal A, Agius P, Sander C, Leslie C 2010. Comprehensive modeling of microRNA targets predicts functional non-conserved and non-canonical sites. Genome Biol 11: R90 doi: 10.1186/gb-2010-11-8-r90 - PMC - PubMed
    1. Bhattacharyya SN, Habermacher R, Martine U, Closs EI, Filipowicz W 2006. Relief of microRNA-mediated translational repression in human cells subjected to stress. Cell 125: 1111–1124 - PubMed

Publication types

LinkOut - more resources